Air pressure changes with altitude.

Air is all around us, but we cannot see it. Gravity from the Earth pulls air down - this is called air pressure. We don't feel this pressure because our bodies push an equal amount of pressure outward. This graph shows how air density and air pressure changes with altitude (the distance above sea level). Barometers are used to measure air pressure in milibars.

This line graphs shows that both air pressure and air density decrease with increasing altitude. The y-axis shows the altitude in kilometers from 0 to 500 in 100 kilometer increments.  The x-axis is labeled with low pressure and density on the left increasing to high pressure and density on the right. The trend lines for both air pressure and air density are low at the highest altitude and are both high at the lowest altitude.

Which of the following statements about the graph are true?

Air pressure is higher at lower altitudes.

Air density is higher at lower altitudes.

There is more space between air molecules at higher altitudes.

There is less oxygen to breathe at the top of a high mountain than there is at sea level.

Temperature changes with altitude.

The atmosphere is divided into different layers depending on how temperature changes. Take a look at the graph below to see how temperature changes with altitude.

This line graph shows how temperature changes with altitude.  The y-axis shows altitude in meters from 0 to 120,000 in 10,000 meter increments.  The y-axis shows lower temperature on the right increasing to higher temperature on the left.  The layers of the atmosphere are labeled by altitiude inside of the graph.  The troposphere goes from 0 to 10,000 meters.  The stratosphere goes from 10,000 to 50,000 meters.  The Mesosphere goes from 50,000 to 85,000 meters. Finally, the Thermosphere goes from 85,000 to 120,000 meters.  The data shows that the temperature decreases in the thermosphere, decreases slightly to 20,000 meters in the stratosphere before increasing.  The temperature then decreases significantly in the Mesosphere before increasing slightly to 100,000 meters in the Thermosphere where it then increases rapidly.

Which of the following statements about the graph are true?

If you follow the temperature line in the graph above from the surface of the Earth to the top of the atmosphere, moving to your left represents a decrease in temperature, to your right represents an increase in temperature, and straight up represents a constant temperature.

Temperature increases as you gain altitude in the stratosphere and the thermosphere.

Temperature decreases as you gain altitude in the troposphere and mesosphere.

Air temperature varies in complicated ways with altitude.

Near the Earth's surface, air gets cooler the higher you climb.

As you climb a mountain, you can expect the air temperature to decrease by 6.5 degrees C for every 1000 meters you gain. This is called the standard (average) lapse rate.

Lapse rate: 6.5 degrees Celsius per 1,000 meters. 3.6 degrees Fahrenheit per 1,000 feet.

A simple chart with a mountain scene in the background.  Labels on the left are: 0 meters altitude (sea level) = 30 degrees Celsius.  1,000 meters = 23.5 degrees Celsius.  2,000 meters = 17 degrees Celsius.  3,000 meters = 10.5 degrees Celsius.

If air temperature is 30 degrees C at sea level as shown above, you can expect it to be around 10.5 degrees C at air altitude of 3000 meters because of the lapse rate.

Plan an Expedition

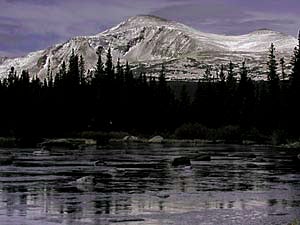
You are going to climb Mount Audubon in Colorado today!

Mount Audubon with a lake and dark trees in front of it

When you leave your house at 2000 meters, the air temperature is 15° C. What is the temperature likely to be at the 4000 meter summit?

Button to select 10 degrees Celsius 10°C
Button to select 28 degrees Celsius 28°C
Button to select 2 degrees Celsius 2°C
Button to select 7.8 degrees Celsius 7.8°C