Carbon Cycle Diagram from the DOE with numbers
Office of Biological and Environmental Research of the U.S. Department of Energy Office of Science
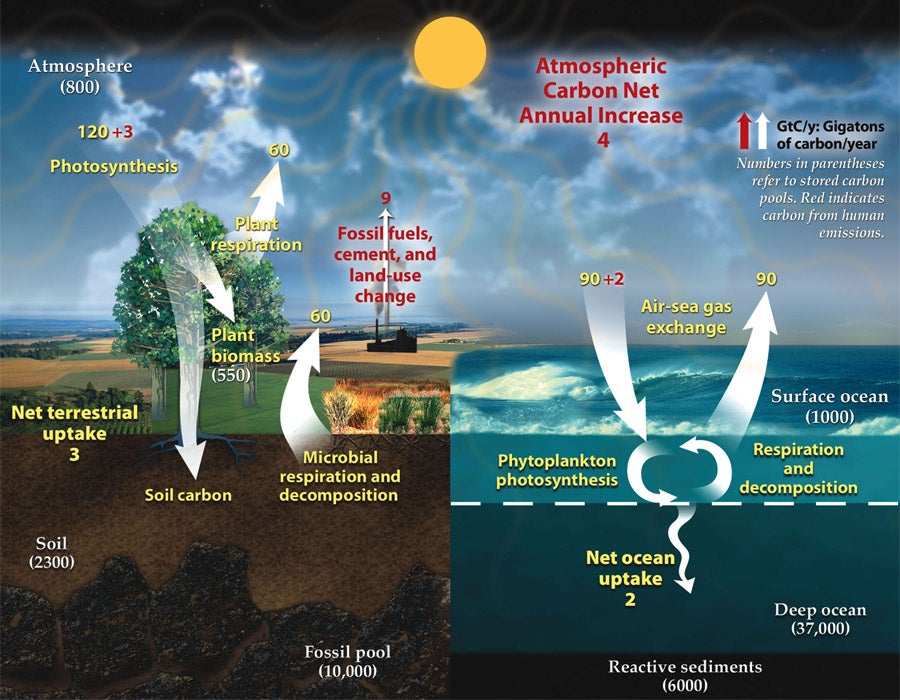
This diagram of the carbon cycle shows the major flows in the "fast" carbon cycle and the main reservoirs of the carbon cycle as a whole (both the "fast" and "slow" carbon cycles). Reservoirs are labeled with white text in units of gigatons of carbon (GtC). Arrows indicate flows of carbon between reservoirs and are labelled with yellow text; flow rates are in gigatons of carbon per year (GtC/y). The sizes of the arrows are roughly proportional to the amount of carbon in the various flows. Red text and numbers indicate changes to the natural carbon cycle caused by human activities, primarily burning of fossil fuels, cement production, and land use changes.