Incorporating Local Weather Into Your GLOBE Weather Unit
Tips for Finding Historical Weather Events, Weather Data From Your Area, and more!
How to Make Learning About Weather Meaningful to Your Students
Your students may not have experiences with the specific weather events presented in GLOBE Weather (extreme rainfall, winter storms, etc.), but they do have experiences with their local weather. Help them consider how weather affects their own communities while learning about a severe weather event from your local area. Incorporating local weather data into the GLOBE Weather lessons can help your students engage with the curriculum.
Connect GLOBE Weather to a Local Severe Weather Event
The Anchoring Phenomenon provided in GLOBE Weather details a storm that caused severe flooding in communities along the Front Range of the Rocky Mountains in Colorado. Consider providing an example of a local storm that has impacted your community to help your students make connections to the anchoring phenomenon.
- Explore a local storm alongside, or even instead of, the Colorado storm.
- Use the prompts within Lesson 1 to discuss your local storm, focusing on how the storm affected your community, and what might have caused the storm to be so severe.
- Return to your local storm each time you are prompted to revisit the Colorado storm.
Ask students:
- How does our model for an isolated storm help to explain our local storm? (Learning Sequence 1)
- How does our model for a cold front help to explain our local storm? (Learning Sequence 2)
- Compare and contrast the Colorado storm with your local storm.
How do I find out about local storms that have affected my area?
- Search for local historical storms that occurred in your area using the NOAA Storm Events Database:
- Search by your state or area, or by storm name (if known).
- Narrow your search by county, storm event type, and date range. *To most closely match GLOBE Weather content, select a storm event that severely impacted your community.
- From your search results, select a location of interest to see more details, including a narrative of the storm. This narrative could provide a helpful description of how the storm affected your area.
- Consider using the NOAA Storm Events Database as a resource to verify information about a storm that you discovered from an unofficial source (anecdotal story, online videos, etc.).
- Find news articles and videos describing the local storm from your area.
- Search the Internet for news reports or videos that will complement the information you found in the NOAA Storm Events Database.
- Select stories and/or videos that will help your students visualize the impact that the storm had on your community.

Incorporate Weather Data from Your Area into GLOBE Weather Lessons
Analyzing local weather conditions can provide opportunities to apply what students have learned in the GLOBE Weather lessons to their own lives.
- Be on the lookout for "just in time" weather examples.
- Is there a weather event happening now, in your area, that parallels what your students are learning in GLOBE Weather?
- When you are instructing Learning Sequence 1:
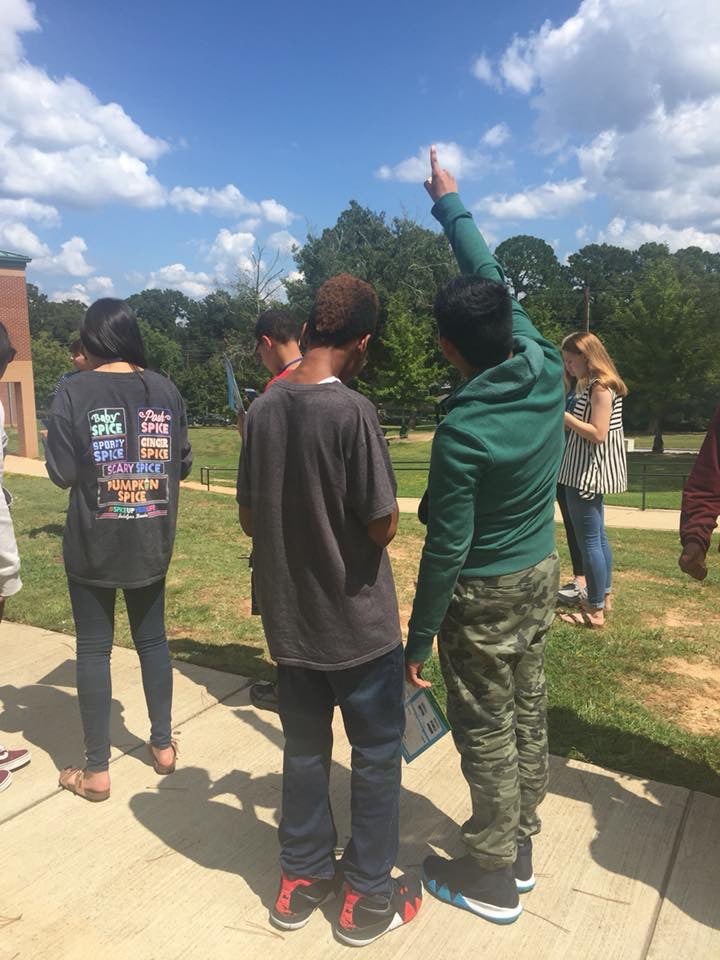
- Check the weather forecast for a day with expected afternoon clouds or rain showers. Have students draw or record a timelapse video from the classroom window to track how the local sky changes throughout the day, similar to what students do in Lesson 2: Step 2. Ask students to make connections between the clouds they saw and whether or not a storm occurred (How much of the sky was covered in clouds? What types of clouds did they see?).
- Gather hourly temperature data from a weather station near you and compare it to the temperature graph in Lesson 3: Step 4. Using data from the nearby weather station, ask students to explain how temperature changes throughout the day, and to predict how the surface temperature might differ from the air temperature. Note: Consider telling students where the weather station you are using is located, particularly if the place is familiar to them!
- Gather hourly humidity data from a weather station near you on a day that it rains, and on another day that it doesn't rain. Compare your local data to data from Lesson 4, asking students what patterns they would expect to see in the local weather data.
- When you are instructing Learning Sequence 2:
- Track weather data from your area over multiple days. Ask students to look for patterns in the data and predict what kind of weather might come next.
- Compare your local 7-Day forecast to the one provided during Lesson 7: Step 3.
-
If a cold front passed through your area recently, ask students to recall what the weather was like before, during, and after the storm. Bring in weather data from the days leading up to, during, and just after the storm for students to analyze (temperature, humidity, precipitation, and wind speed). Compare your local data to data from Lesson 8.

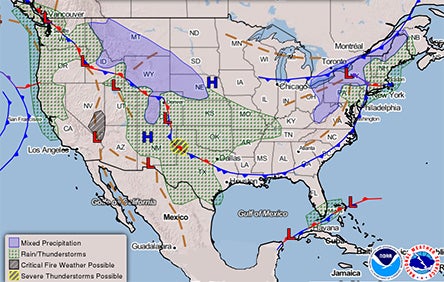
- Practice identifying weather symbols on a weather map from the local news. Look for an example with fronts, low pressure areas, and/or high pressure areas.
- When you are instructing Learning Sequence 3:
- In Lesson 13, have students research to find the latitude coordinates and the maximum and minimum daily temperatures for one year for your area. Compare your latitude and temperature data to somewhere with a different latitude, asking students to explain which location they expect to have warmer weather, and why.
How do I Find Local Weather Data to Use With My Students?
- There are many sources for local weather data, such as local news weather stations and weather forecasts. Also, you can find data from weather stations that are near your location using Weather Underground:
- Search for your location to view current atmospheric conditions.
- View weather data from any nearby weather stations, including personal weather stations (PWS) and national weather stations (NWS).
- View past weather data from specific weather stations.
- Find out if a GLOBE school near you has recent measurements using the GLOBE Visualization System:
- Refer to the Learning Sequence 2: GLOBE Connections activity for an example of how to use the Visualization System. Instead of searching for Freedom High School data, zoom in on the map to find a GLOBE school near your location.
- View active weather alerts and forecast maps in your area or across the U.S. from the National Weather Service.

Collect Weather Data From Your Location
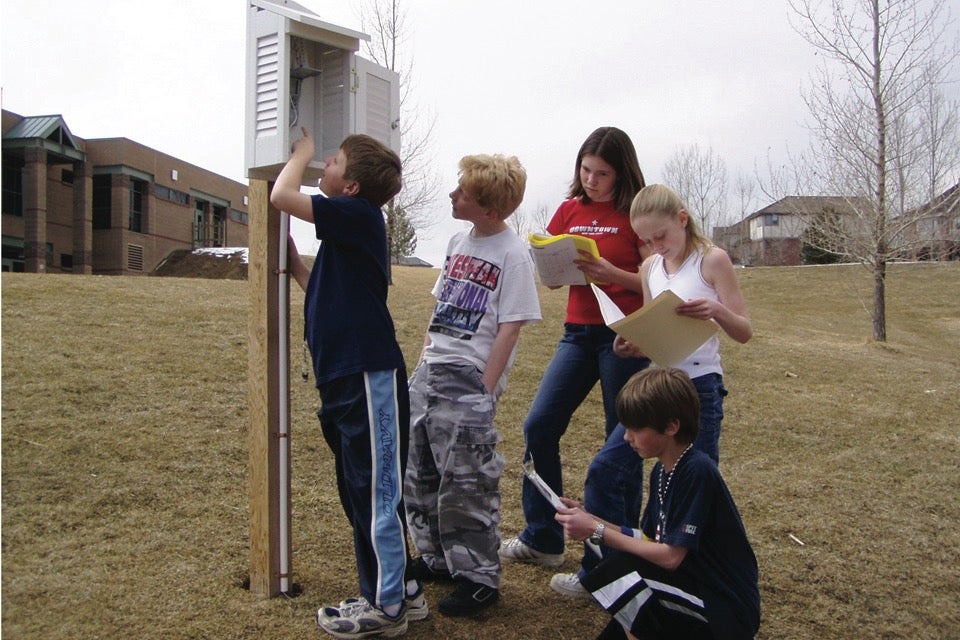
- Use the GLOBE Atmosphere data collection protocols to collect weather data at your school.
- GLOBE Weather references the clouds, surface temperature, and barometric pressure protocols, but there are several additional protocols you might choose to use. Note that specialized equipment may be required.
-
Install a weather instrument shelter or an automated weather station at your school.

- GLOBE provides instructions for installing an instrument shelter to house your weather instruments (follow GLOBE specifications when deciding which weather instruments to purchase for your instrument shelter).
- An automated weather station is a more substantial investment, but will allow your school to gather and share weather data that can benefit the larger community. GLOBE provides these Supporting Protocols for a selection of automated weather stations to consider installing at your school.

Weather is always "happening," and new weather data is generated every day. Fortunately, weather data, both current and historical, is also fairly easy to access. This creates many opportunities for students to authentically engage with the science practices during your weather unit. We encourage you to help students connect with their local weather as they learn about the science of weather.

