Hunting for the Pineapple Express
In this activity, students identify the location of an atmospheric river (called the Pineapple Express) over the Pacific Ocean by analyzing water vapor data collected by COSMIC satellites. Based on their analysis, students make a prediction about where the atmospheric river will make landfall and then check their prediction by examining rainfall data along the U.S. West Coast.
Learning Objectives
- Students will learn that atmospheric rivers create heavy rainfall on the west coast of North America.
- Students will learn how to locate an atmospheric river (known as the Pineapple Express) over the Pacific Ocean using water vapor data from COSMIC satellites.
Materials
For each student:
- NOAA article: What are atmospheric rivers?
- Pencil and eraser
- Colored pencils
For the class:
- Google Earth, map of the world, or a globe
- NCAR Water Vapor and Precipitation Simulation (optional)
- NOAA infographic: The science behind atmospheric rivers
- Projector and screen
Directions
Part 1: Set up the situation.
- Have students read NOAA Article: What are atmospheric rivers?
- Project the NOAA graphic describing atmospheric rivers and review the parts with students. Share that an atmospheric river is water vapor, not liquid water, but it forms liquid water in clouds and rain when it gets to land and is forced upward.
- Show students the West Coast and the Pacific on a world map, globe, or Google Earth. Explain that the direction that atmospheric rivers flow is determined by large scale atmospheric circulation. (For a more in-depth introduction, show students the NCAR Water Vapor and Precipitation Simulation and have students observe how water travels in the atmosphere.)
- Tell students that in this activity, they will explore water vapor data collected by COSMIC satellites over the Pacific to figure out where along the West Coast of North America an atmospheric river is likely to make landfall.
Part 2: Investigate mapped data.
- Hand out the Student Sheet: Mapping the Pineapple Express and colored pencils.
- Orient students to the location of the map (the north Pacific and West Coast of North America) and to the concept of precipitable water, which is a measure of the amount of water in the atmosphere. If you imagine a column of air that goes from the Earth's surface to the top of the troposphere, the precipitable water is the amount of water vapor in the full column of air if it were liquid water instead of vapor. It's measured in millimeters of depth, just like rainfall.
- Have students follow the directions, coloring the dots on the map depending on the amount of water vapor. This should help students identify the location of the atmospheric river over the Pacific.
- Instruct students to draw in the "edges" of the atmospheric river and then make predictions about which locations along the West Coast are likely to get rain. (Students should recognize that there are locations like Seattle and Astoria where rain is certain, there are locations like Tijuana and Los Angeles where no rain is certain. And then there are locations between Eugene and San Francisco that are less certain because it's hard to know where the edge of the atmospheric river is located.)
Part 3: What actually happened?
- Provide students with the Student Sheet: Rainfall Data.
- Have students compare the rainfall totals to the predictions that they made in Part 2.
- Discuss as a class or in small groups:
- What locations got heavy rainfall?
- Were your predictions correct, partially correct and partially incorrect, or completely incorrect? Why or why not?
- Explain if there were any surprises.
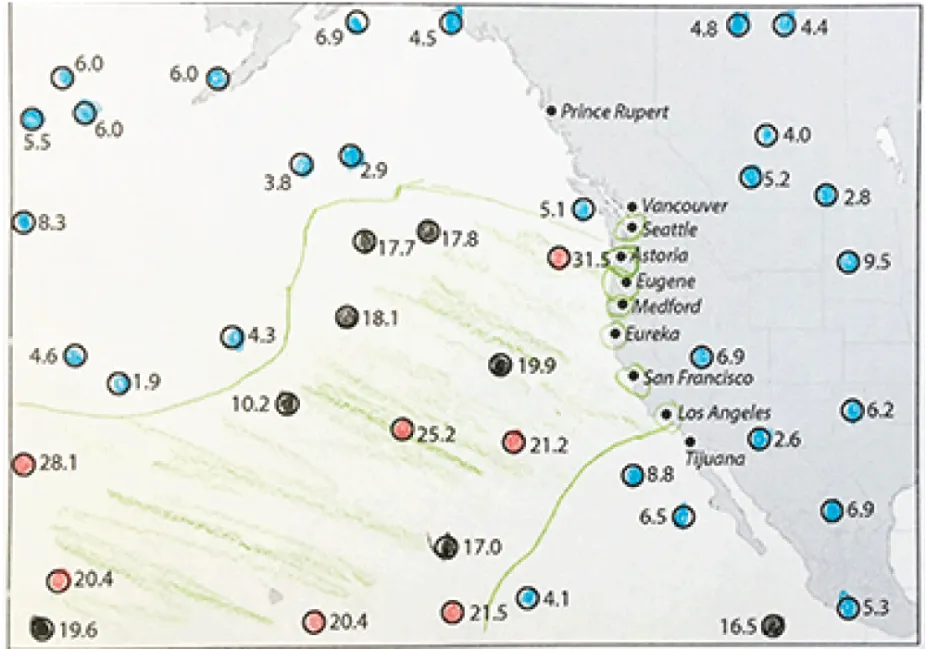
Example of a map that students make during the Hunting the Pineapple Express activity
UCAR/John Ristvey
Background
Atmospheric Rivers
Imagine a river in the sky - one made of water vapor, instead of liquid water. That’s an atmospheric river and it can transport moisture long distances.
Over the North Pacific, atmospheric rivers transport water vapor over the ocean to the West Coast of North America. When the moisture gets to land, it’s pushed upward, which causes much of the water vapor to condense, forming intense precipitation. Heavy rain and snow can cause hazards like floods but is also beneficial for agriculture and drinking water supplies.
Why is it called the Pineapple Express?
The atmospheric river pattern over the North Pacific is often called the “Pineapple Express” because it moves moisture from Hawaii, where pineapples are grown, to the west coast of the United States and Canada, where it can cause heavy rain and snow.
The event on November 6-8, 2006
In this activity, students analyze humidity and rainfall data from a particularly intense atmospheric river over the Pacific that caused heavy precipitation in northwest Oregon, Washington state, and southern British Columbia from November 6-8, 2006. Mudslides and flooding were widespread. Eleven counties in Washington were declared national disaster areas. In Mount Rainier National Park, floods washed out roads and campgrounds.
About COSMIC satellites and data
COSMIC is a group of small satellites (called microsatellites) that measures how radio waves from GPS satellites bend while traveling through the atmosphere in order to deduce the characteristics of the atmosphere, such as the temperature and amount of water vapor. Because COSMIC is able to make these measurements for different altitudes in the atmosphere and over the ocean - places where weather data is sparse - the data has an important role in helping meteorologists predict weather and is added to weather models to make forecasts more accurate.
- For more information: The Little Satellite Fleet that Could (Science, 2006)
References
This data exploration is based on the weather events and COSMIC data described in two papers:
- Ma et al. (2011) Assimilation of GPS Radio Occultation Data for an Intense Atmospheric River with the NCEP Regional GSI System, Monthly Weather Review, v. 139, pp. 2170-2183.
- Neiman et al. (2008) Diagnosis of an Intense Atmospheric River Impacting the Pacific Northwest: Storm Summary and Offshore Vertical Structure Observed with COSMIC Satellite Retrievals, Monthly Weather Review, v. 136, pp. 4398--4420.