A Tale of Two Hurricanes
![]() This is Part 2 of Lesson 3 of Project Resilience curriculum.
This is Part 2 of Lesson 3 of Project Resilience curriculum.
Students use data about Hurricane Michael and Hurricane Florence to investigate how hurricanes affect the Louisiana coast.
Learning Objectives
- Students will explore hurricane data to learn that different hurricanes cause different types of damage in coastal communities where they make landfall.
Materials
- Project Resilience Slide Deck (slides 40-43)
- A Tale of Two Hurricanes: CER Student Sheet (PDF)
- Lesson 3: Hurricane Data (PDF)
Preparation
- Familiarize yourself with Hurricane Michael and Hurricane Florence, and Lesson 3: Hurricane Data.
- Print or make electronic copies of the Hurricane Data available for student use. *Note: Students will need to view the Lesson 3: Hurricane Data in color to be able to accurately interpret the maps and images. If you are unable to print color copies, consider having students use digital versions or projecting the data. Depending on class size, you may wish to print one copy of the Hurricane Data set to spread out at stations around the classroom that students visit during the data exploration activity.
- Print copies of the A Tale of Two Hurricanes: CER Student Sheet.
Directions
What types of hazards can a hurricane cause? (15 min)
- Open class by connecting with a local example of a hurricane.
- Remind students of a hurricane or tropical storm that affected your location and what sorts of damage occurred.
- Split students into pairs and have them take turns sharing a story about a hurricane they have experienced.
- Call out any common themes that emerge from these discussions.
- Have students navigate to and read through the overview of Hurricane Hazards from NOAA on the National Hurricane Preparedness website.
- Ask them to focus on the types of hazards that a hurricane can cause. They might choose to make a list of these hazards.
- The following hazards are discussed in the article. Note that the first three listed are the most common hurricane hazards, which will be the focus of this lesson.
- Storm surge
- Rain and inland flooding
- Winds
- Tornadoes
- Rip currents
- Tell students that not all hurricanes are the same - some cause one type of hazard, some cause many different types of hazards. The hazards are related to a hurricane’s characteristics (slide 41), such as:
- Winds: Some have high winds, and others have lower winds. Wind speed defines the Saffir-Simpson Category of a hurricane.
- Size: Some are geographically large, and others are smaller. Size controls the area impacted by strong winds. Size (in combination with how fast the storm is moving inland) also controls how long the damaging winds blow for and how long it rains.
- Speed: Some hurricanes travel fast, and others move slowly.
- Winds: Some have high winds, and others have lower winds. Wind speed defines the Saffir-Simpson Category of a hurricane.
Introduce data exploration. (10 min)
- Tell students that they are going to compare the impact of two hurricanes that hit the U.S. coast in 2018: Hurricane Florence and Hurricane Michael.
- Show students the 2018 hurricane tracking chart (slide 42). A small version is below, as well as a larger pdf version, should you want it. Point out that there were many more storms in 2018. We will just be comparing the two that caused the most damage in the U.S. that year.
- While looking at the hurricane tracking map, point out that there is a white circle along each storm’s track that indicates noon. This means the distance between two white circles along a path is how far a storm moved in 24 hours.
- Ask: What do you notice when you compare the paths of Michael and Florence?
- Students should notice that the white circles are closer together on the Florence path, indicating that it was moving more slowly.
-
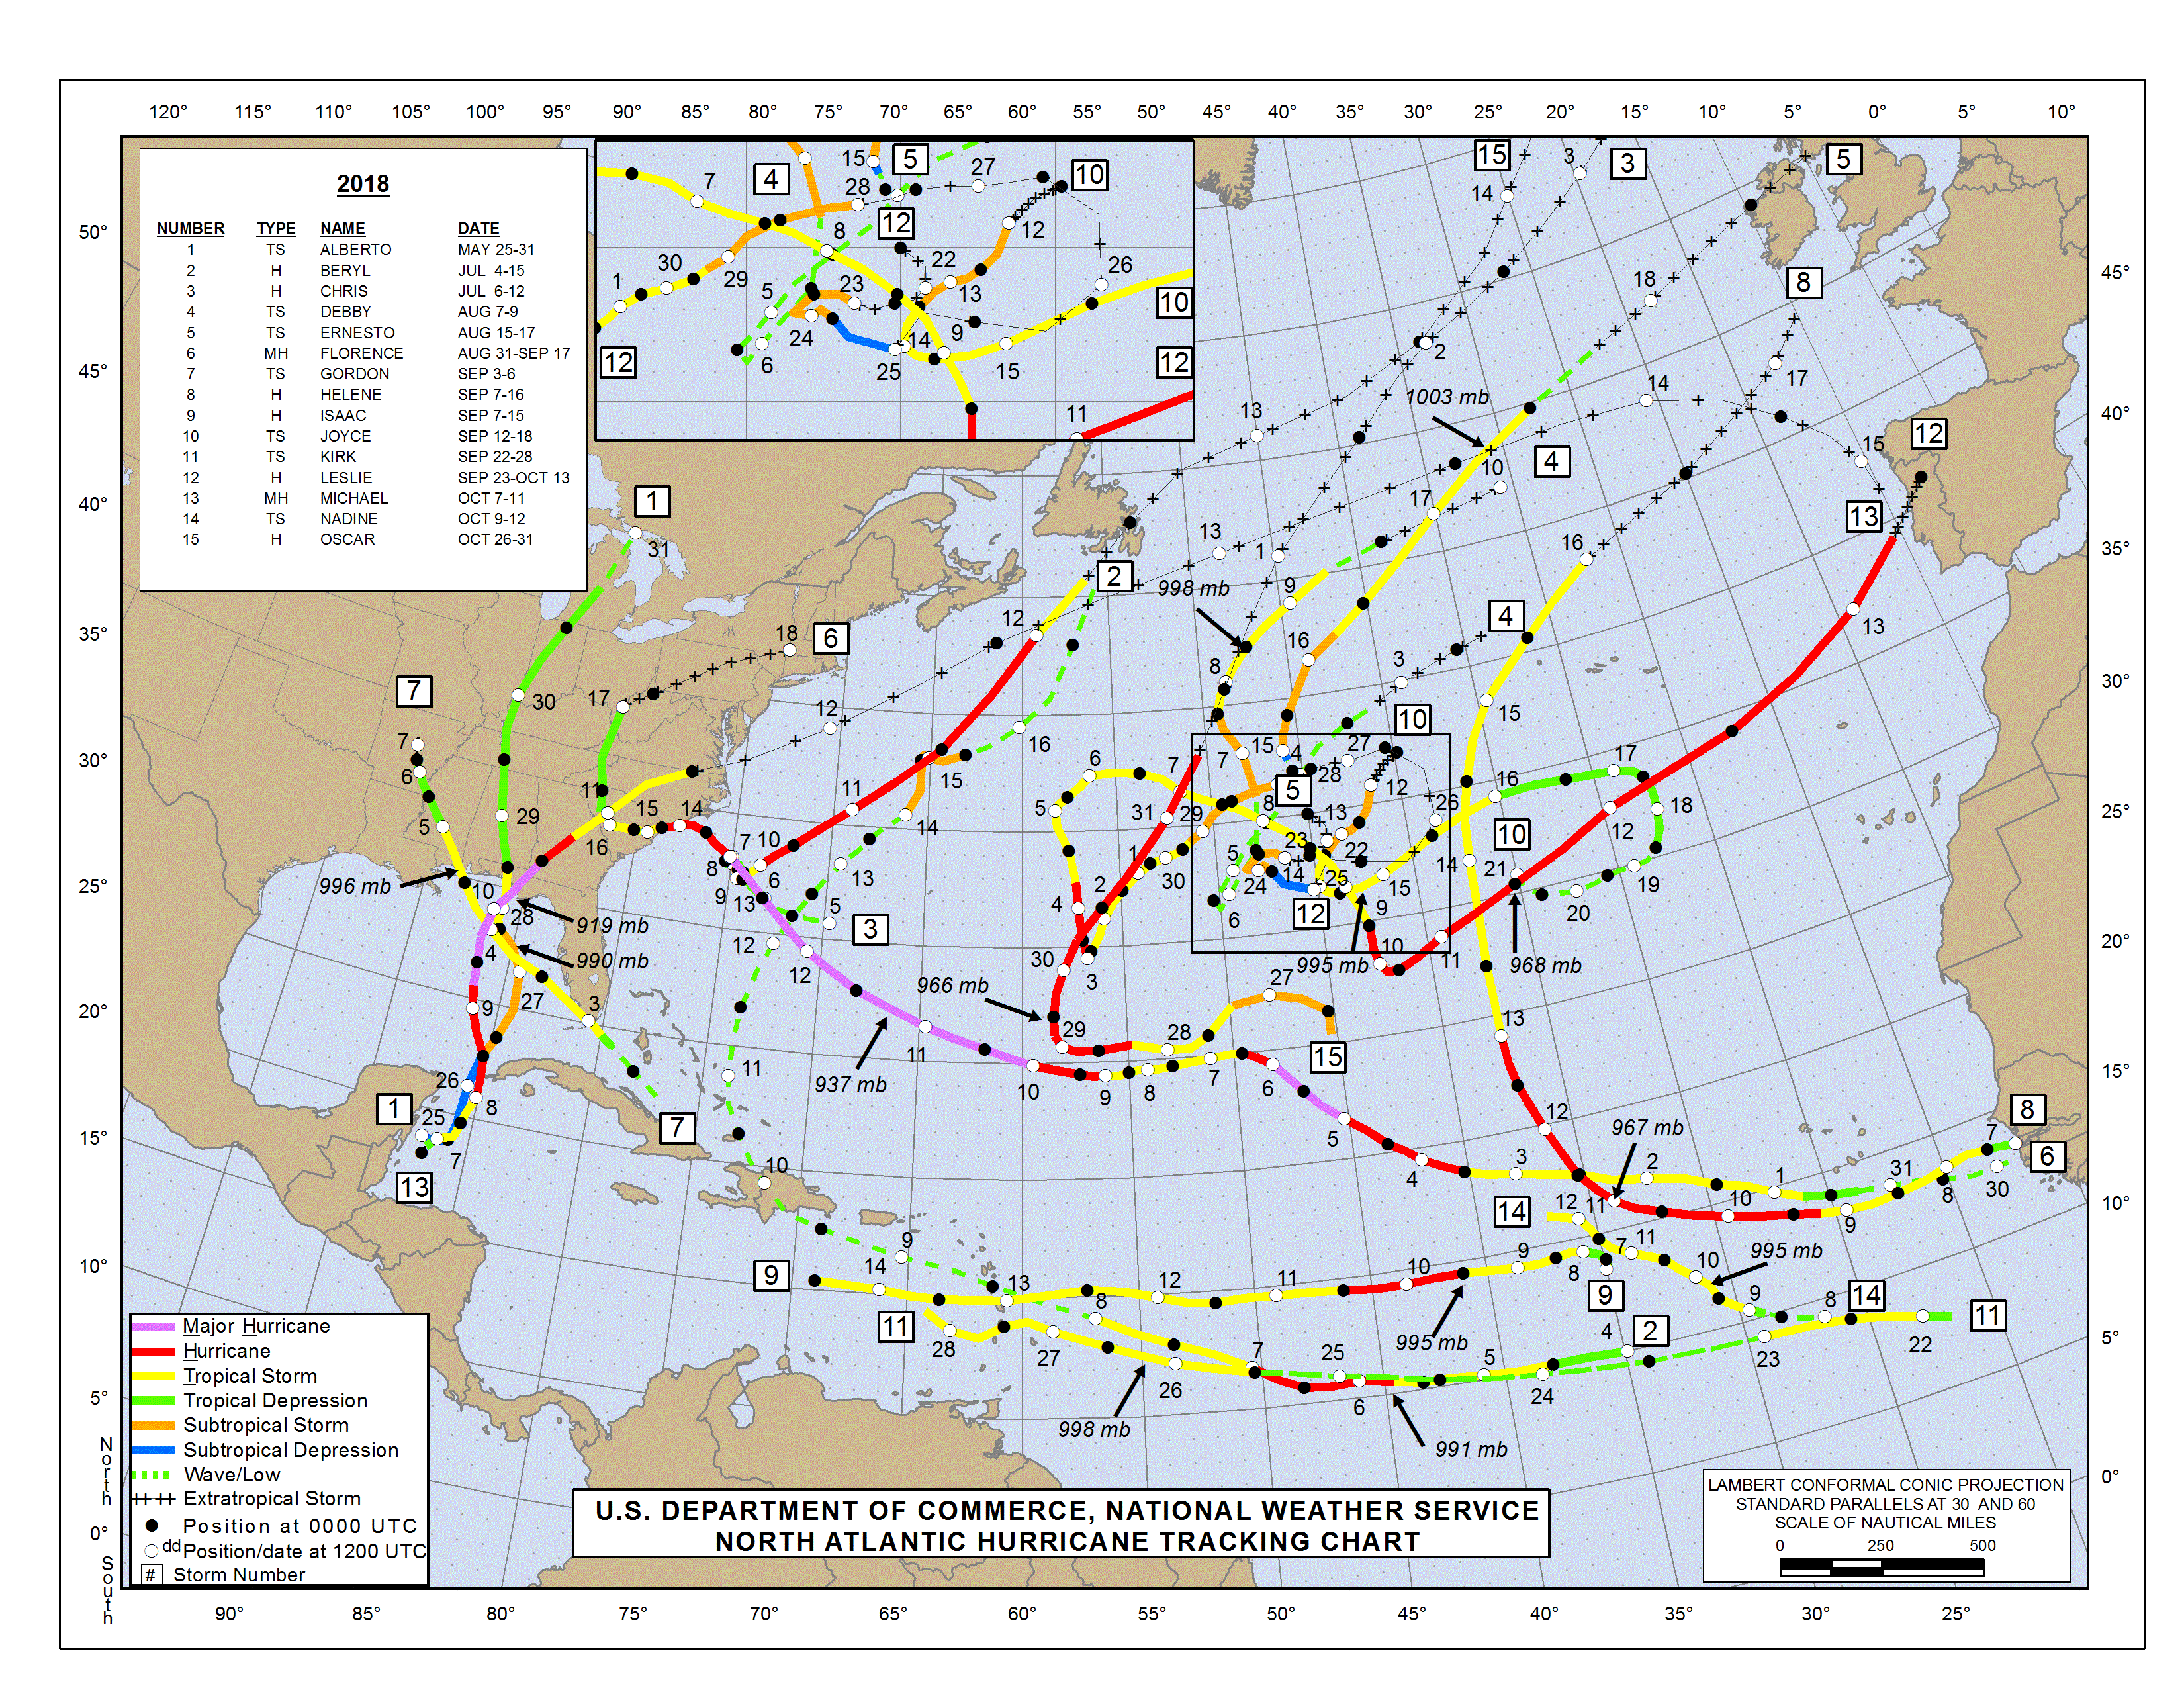
Florence: Traveled more slowly in the Atlantic and made landfall in North Carolina on September 14, 2018. The maximum sustained winds were approximately 90 mph (Category 1) when it made landfall.
Michael: Traveled quickly through the northeastern Gulf of Mexico and made landfall in the Florida panhandle on the afternoon of October 10, 2018. The maximum sustained winds were 160 mph (Category 5) when it made landfall.
Student data analysis (20 min)
- Pass out copies of the Tale of Two Hurricanes: CER Student Sheet.
-
Direct students to use the Lesson 3: Hurricane Data about the impacts of Hurricane Florence and Hurricane Michael to answer the question: Which hurricane caused the most damage, Hurricane Florence or Hurricane Michael? (slide 43)
- Students can work in pairs or visit stations on their own to explore the hurricane data.
- Students will make a claim, cite evidence from the data about the storms, and then explain their reasoning using the Tale of Two Hurricanes: CER Student Sheet.
Note: Students will need to view the Lesson 3: Hurricane Data in color to be able to accurately interpret the maps and images.
Note: Satellite images of both hurricane locations are included within the Lesson 3: Hurricane Data (see PDF). It may also be helpful if each student uses a map of the area as they explore the data to become familiar with the location of flooding, high storm surge, etc.
Revisit Driving Question Board (10 min)
- Have students revisit the class Driving Question Board (DQB) that they created in Lesson 1. Ask the following questions:
- Are there any questions that we can now answer?
- Do we want to re-arrange any of the questions? Are there any connections between topics that we should show on the DQB?
- Would anyone like to add any additional questions?
Assign Journal Prompt #7
- Prompt #7: What is the tale of a hurricane that has affected your family or community? If you have not experienced a hurricane yourself, ask a family member or friend who has to tell you about it. Describe what you or they remember the most, and how things were different in the months and years after the storm. Imagine what it might be like to experience hurricanes in coastal Louisiana 20-30 years from now. How and why might things be different?
Background
Hurricanes, known more generally as tropical cyclones (TCs), are weather systems that form in the tropics (typically 30° North and South of the equator) and generate severe winds (i.e., 63 km/h, which is 39 mph) that rotate counterclockwise in the Northern Hemisphere and clockwise in the Southern Hemisphere. Tropical cyclones with sustained winds exceeding 119 km/h (74 mph) are known as hurricanes over the North Atlantic, Central Pacific, and East Pacific and are called typhoons over the western North Pacific. Over the Indian Ocean and the South Pacific, TCs are called cyclones. TCs mainly occur during the summer season (which is at opposite times of the year in the Northern and Southern Hemispheres).
Where they form and travel
Similar to a stick floating down a stream, the route, or track, of a TC is largely controlled by the prevailing winds, which, at tropical latitudes (30°), typically flow from East to West and are called Trade Winds. At higher latitudes, prevailing winds flow from West to East.
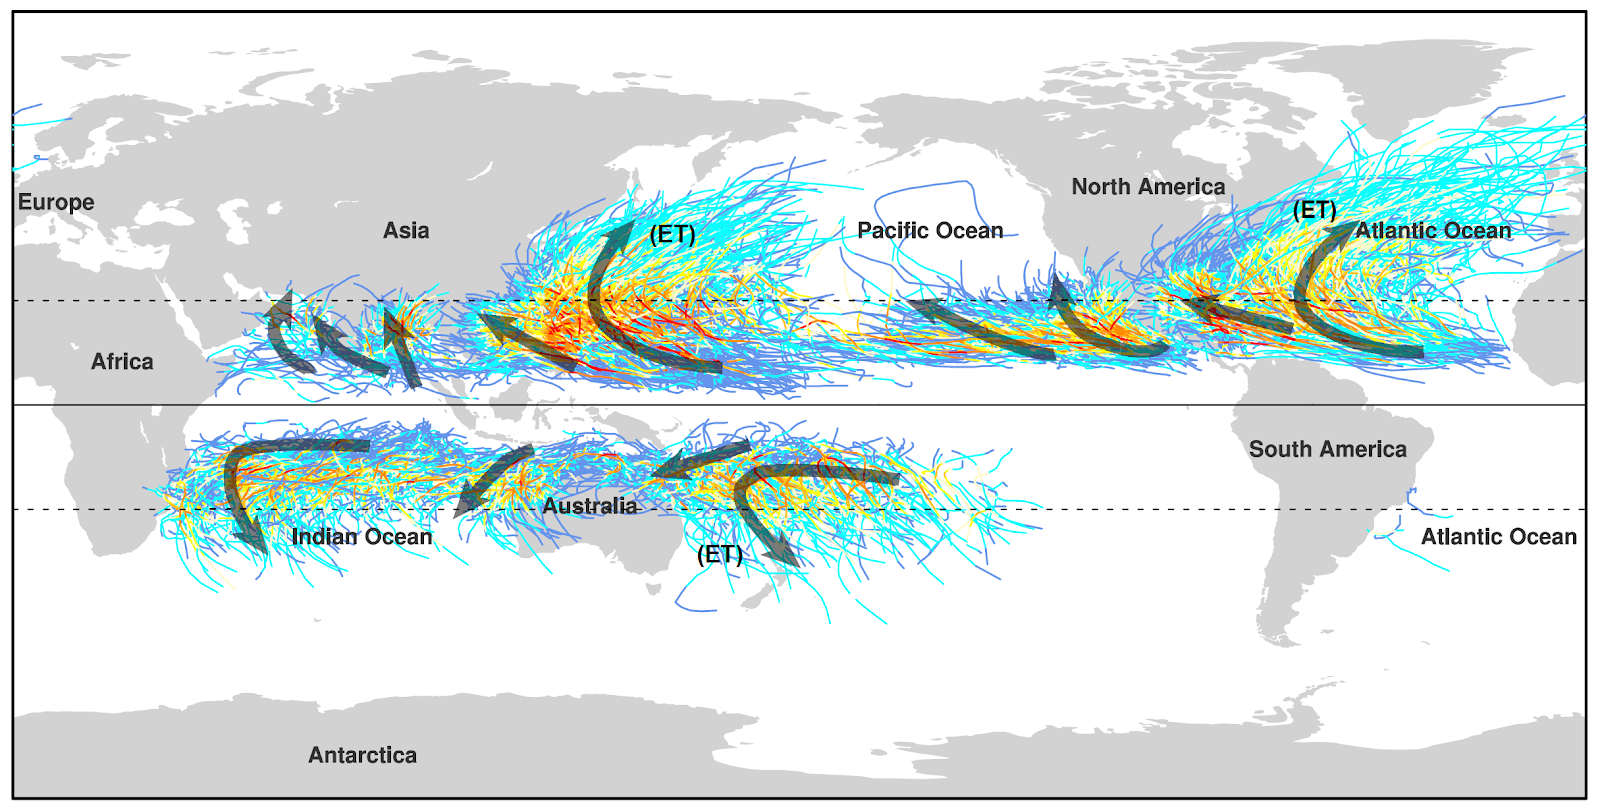
The world map above shows the tracks of tropical cyclones (TCs) between 1980 and 2013 colored by Saffir-Simpson category. Arrows indicate general TC tracks, and ‘(ET)’ indicates where TCs can transition to become extratropical storms (i.e., outside the tropics). TCs are most prevalent from June to November in the Northern Hemisphere peaking in mid-September, and from November to April in the Southern Hemisphere peaking in mid-February. Notice that TCs occur only rarely over the South Atlantic and the eastern South Pacific.
Anatomy of a Tropical Cyclone
Mature TCs are approximately symmetrical around a central eye. The eye is a calm area surrounded by a wall of strong winds and rain known as the eyewall.
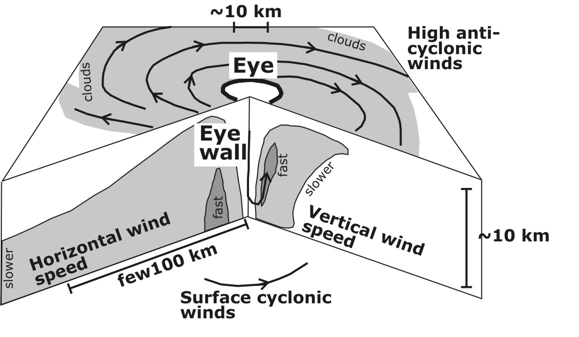
The illustration above shows the basic structure of a TC and the terms used for different parts of a storm. Horizontal winds spiral cyclonically inwards and are at their fastest just above the ground or ocean surface and in the eyewall where vertical winds send air high into the upper troposphere and lower stratosphere. This air that moves upward fans out anti-cyclonically at the top of the storm, which means that the winds at the top of the storm are rotating opposite to the winds at the bottom of the storm. In the Northern Hemisphere, cyclonic is anticlockwise, and anticyclonic is clockwise (note the wind directions in the diagram above). Winds rotate in the reverse pattern in TCs that occur in the Southern Hemisphere.
Typically, TCs transfer heat energy from the tropical ocean surface, where sea surface temperatures (SSTs) are more than 26° C, into the atmosphere. This process is called cyclogenesis. Several other factors must also align for a TC to form. For example:
- Warm, moist air with a tendency to rise, is essential for a TC to form. The rising air moves heat energy higher in the atmosphere and establishes the storm’s structure.
- Humid conditions at mid-levels are needed to limit the number of downdrafts of dry air to the surface.
- For a TC to form, wind shear must be low. Wind shear is the difference between winds at low and high altitudes. When strong, it can tear apart a developing TC.
- Finally, a trigger is needed to start a TC. Triggers can be various types of atmospheric phenomena, including trailing cold fronts, monsoonal circulations, or pulses of energy in the atmosphere known as tropical waves.
While all tropical cyclones have similar morphology, as shown in the figure above, they vary in terms of their geographic scale, wind speeds, the amount of water vapor they carry, and the speed they move.
- Geographic scale:A small TC may have hurricane-force winds over an area about 150 km (about 90 mi) across, like Hurricane Michael in 2018, while a very large TC might have hurricane-force winds that affect the coast of several states as the storm makes landfall.
- Storm speed: TCs also vary in the speed they travel, which is called translation rate. Slow-moving TCs may stall completely while fast-moving storms, like Hurricane Michael, travel over 500 km (312 miles) in 24 hours.
- Wind speeds: Historically, wind speeds are used to categorize TCs according to the Saffir-Simpson Scale. Tropical depressions and tropical storms have weaker winds. Saffir-Simpson categories (between 1 and 5) are assigned to TCs depending on wind speed within the storm. (See the Saffir-Simpson Scale graphic below.)
- Water vapor: TCs generally carry large amounts of water vapor and clouds, but some storms carry more water than others. A TC with large amounts of water can cause intense rainfall. For example, Hurricane Harvey dropped between 30 and 60 inches of rain in the Houston, TX area in 2017.
Flooding from Cyclones
The most dangerous storms are not necessarily the strongest at landfall. Only three of the ten deadliest tropical cyclones were “major hurricanes” (Category 3 or higher on the Saffir-Simpson Scale) when they came ashore. Six of the ten were tropical storms or Category 1 hurricanes at landfall.
Although hurricanes are categorized into the Saffir-Simpson scale according to their wind speeds, most fatalities associated with hurricanes are caused by floodwater, not wind. Flooding is caused by two factors: storm surge and rainfall.
Storm surge: One of the most dangerous hazards associated with TCs, storm surge is responsible for about half of all TC-related fatalities. Storm surge happens when the ocean spills out over the land as a TC makes landfall. The strong TC winds exert a pull on the ocean surface, which sets the surface layer of the ocean into motion. The strength of the storm surge depends on the peak hurricane winds, the area covered by strong winds, how fast the storm is moving towards land, and the shape of the coast and shallow ocean. Surge is also driven in part by the low surface pressures at the center of the storm. The surge builds up over many days tracking with the storm and spills out over the land as the storm makes landfall. Storm surge can inundate coastal locations with many feet of fast-moving water in a matter of minutes.
- NCAR visualization of storm surge flooding: Researchers at NCAR used a three-dimensional GIS model to create this visualization, which shows how fast storm surge can flood an urban area during a hurricane.
Rainfall: The amount of rainfall depends on how much moisture a tropical cyclone is carrying and the speed at which a storm is moving. A TC that carries a lot of moisture and is slow-moving can cause a large amount of rain to fall in one location. The rain floods rivers and impervious urban areas. The amount of flooding caused by rain depends on the land topography, and whether the water can permeate into the ground.
About Hurricane Michael
Michael was the third most intense hurricane ever to make landfall in the United States. The storm’s central pressure plunged to 919 hPa at landfall, which caused very high winds (sustained 1-minute average winds were 160 mph). These were the strongest U.S. landfalling winds since Hurricane Andrew in 1992.
Hurricane Michael formed within rich, moist air of the Caribbean and over unusually warm ocean water. The sea surface temperatures were 2-4°F above normal. The intensifying storm became embedded within a southerly flow between two large weather systems. Forecast models handle these large-scale weather systems very well, which led to excellent track forecasts.
Michael continued to intensify as it moved northward across the Gulf of Mexico. However, even at Category 3 intensity, Michael had not formed a complete eye-wall structure. Eventually, overnight on Oct 9th, a complete eye-wall formed, allowing the robust storm’s winds to jump to Category 5 speeds. Nothing stood between the storm and the Florida coast, other than warm waters, which fueled the storm. The storm continued to intensify right up until landfall.
Michael produced devastating winds and storm surge. Damaging winds extended far inland, even bringing Category 3 winds into southwest Georgia. The storm was directly responsible for 16 deaths and about $25 billion in damage in the United States.
About Hurricane Florence
What started as a distant prospect off the African coast developed over many days to be a record-breaking U.S. event. Hurricane Florence broke rainfall records for tropical storms in North and South Carolina. Rains in South Carolina peaked at nearly two feet, while rains in North Carolina reached almost three feet.
Florence intensified rapidly offshore, supported by warm waters that extended to great depth. High winds were generally light, which allowed the storm to mature. Florence was guided around the southern side of a subtropical high-pressure system, towards the U.S. Florence then put on the brakes as it came up against a high-pressure region over the Ohio Valley. With its path blocked, it got stuck for days.
Stalling near the coast meant that half of the storm remained over the ocean and allowed the storm to pump moisture inland continuously for many hours. This dangerous scenario of a stalled coastal hurricane was eerily reminiscent of 2017’s Hurricane Harvey, setting the stage for unprecedented state rainfall and a storm surge that spanned multiple tide cycles.
References
- Sea level rise in the United States:Sweet et al. (2017) Global and regional sea level rise scenarios for the United States
- Hurricane Fatalities:Rappaport, E.N., 2014: Fatalities in the United States from Atlantic Tropical Cyclones: New Data and Interpretation. Bull. Amer. Meteor. Soc., 95, 341–346.
- Before and After: Coastal Change Caused by Hurricane Michael (USGS)
- Hurricane Michael's heavy rainfall measured by NASA (AAAS EurekaAlert!)
- Hurricane and Typhoon Updates: Michael 2018 (NASA Blogs)

Credits
This activity was developed for Project Resilience, funded by the Gulf Research Program of the National Academies of Sciences, Engineering, and Medicine.