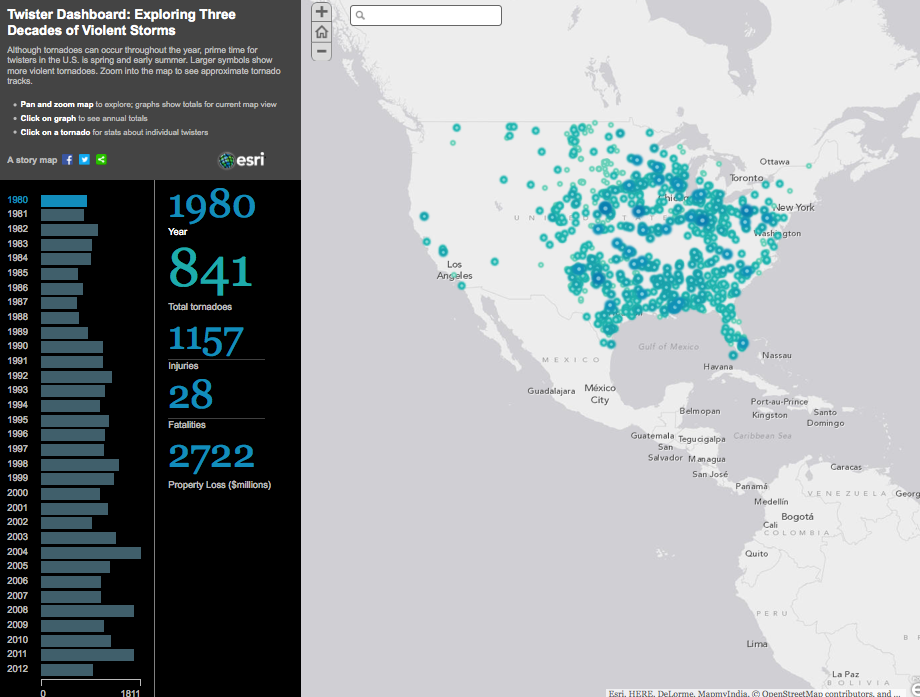
Interactive Story Map: Twister Dashboard: Exploring Three Decades of Violent Storms
Students investigate three decades of tornado data through an interactive Story Map.
Learning Goal
Students understand how data and geospatial technology can be used to understand where tornadoes form and how they are classified.
Learning Objectives
- Students explore an interactive Story Map of three decades of tornado data, observe patterns, and summarize key points.
- Student groups present information about tornadoes.
- Students communicate the characteristics of tornadoes and geographic distribution.
Materials
- Computers or tablets with Internet access (enough for students to work in groups of two or three)
- Online Interactive: The Twister Dashboard Story Map
- Projector and screen
-
(optional, advanced)
Directions
Introduction
- Begin by having the students exploreThe Twister Dashboard Story Map independently or in small groups. Tell students to select one of the map's tools that they will share with the class.
- Have students generate questions they have about tornadoes while they explore the map (size, location, geography). Post these questions in the classroom and revisit them during the "intellectual engagement" activities (below).
- Consider including background about the location of tornadoes, the Enhanced Fujita Scale, and how tornadoes form. (See The Tornado Teaching Box for related educational resources.)
- After students have had time to explore, project The Twister Dashboard Story Map and ask each student or group to share one of the tools with the class (zoom in and out, click on a year, click on a tornado, search the name of a town or state, etc.).
Intellectual engagement
- Tell students that, for this project, they will explore parts of the United States to answer the following questions: Where do tornadoes happen? How far tornadoes travel? What patterns do tornadoes cause? How does geography affect the location of tornadoes?
- If students are not familiar with the geography of the United States, demonstrate the geographic features of the U.S. using a Google Map before students start their Story Map explorations.
- Familiarize students with Student Sheet A: An Exploration of Three Decades of Storms and Student Sheet B: Using the Story Map to Find Missing Pieces
- Have students work independently or in small groups to complete the activities.
Ideas for Deeper Data Analysis
- Have students graph characteristics related to the question they are investigating and note patterns in the graphed data. Perhaps they notice certain months have more tornadoes, certain regions have higher EF scale tornadoes, or some longer tornadoes cause more injuries, while some longer tornadoes do not cause more injuries (perhaps depending on the population in these areas).
- Have students compare tornado patterns from the 1950's with more recent data. Have them consider whether there are more tornadoes today or whether our ability to detect and report tornadoes is better today.
- The maximum over the past 40 years is in April, but the spatial maximum each year does not occur until August. Why do you think that is?
- Have students pick two regions (i.e. two cities in different states) and compare the number of tornadoes. Zoom in to each city to see the direction of tornado paths - are they similar or different? Why?
- Have students pick one of the tornadoes they identified in Student Sheet B: Using the Story Map to Find Missing Pieces and research more about that specific tornado. Have students work independently or in groups to create a presentation or digital narrative about the tornado (history of the tornado, geography, media reports, human impacts)
- Sample digital narrative: The community of Moore, Oklahoma
Sense-making
- Review the questions about tornadoes that students have posted in the classroom and encourage the class to discuss the answers.
- Have students examine the Google Map of the United States and compare various features of the United States and the locations with the highest and lowest concentrations of tornadoes. What correlations do they see in these two different maps of the United States?
Adaptations for High Interest/Low Reading Level
- Use only the interactive map and allow students to interact with the Story Map to visually explore the characteristics of tornadoes.
Background
Tornadoes
Storms such as thunderstorms and hurricanes become even more dangerous when they spawn tornadoes. A dark funnel cloud extends down below the clouds of the storm. If it does not reach the ground, then it is called a funnel cloud. If it does reach the ground, it’s a tornado. Debris and dust are kicked up where the narrow end of the funnel touches the ground.
Tornadoes, also called twisters, are columns of air rotating dangerously fast. The air is in motion because of the difference in pressure between the center of a tornado (very low pressure) and the outer edge of the tornado (high pressure). Some tornadoes are narrow, only 250 feet (75 meters) across where they touch the ground. Other, massive tornadoes can be up to two miles across. Often a tornado will touch the ground for only a few minutes and travel less than a mile. But some tornadoes touchdown for much longer, plowing through several towns, neighborhoods, or farms.
After a tornado has come and gone, scientists look at the amount of damage that it caused to figure out the strength of the twister. They use the Enhanced Fujita (EF) Scale - six categories that describe how tornado damage relates to wind speeds. According to the scale, EF0 is the weakest tornado category with gusts up to 85 mph (135 kph) and EF5 is the strongest tornado with wind gusts over 200 mph (320 kph).
In general, tornadoes fall into three types: weak tornadoes, strong tornadoes, and violent tornadoes based on the tornado size, how long it lasts, and how much damage it causes.
- Weak tornadoes usually last less than 10 minutes, have winds less than 100 mph (160 kph), and cause damage such as broken tree branches and damaged roofs. Over two-thirds of all tornadoes are weak. Weak tornadoes include those in the first two categories of the Enhanced Fujita Scale (EF0 & EF1).
- Strong tornadoes can last 20 minutes or longer and have winds between 110-205 mph (177-330 kph) - strong enough to demolish mobile homes and overturn trains. Nearly a third of tornadoes are strong and they cause nearly a third of all tornado-related deaths.
- Violent tornadoes can last over an hour and have wind speeds greater than 205 mph (330 kph). These monster tornadoes are able to toss cars and houses into the air and carry them for miles. While violent tornadoes are the least common, they are the most deadly, causing over two-thirds of all tornado-related deaths. A violent tornado is part of the last two categories on the Enhanced Fujita Scale (EF4 & EF5).
Tornadoes can occur anywhere in the world. About 75% of the world’s tornadoes form in the United States - most in an area of the central United States called Tornado Alley.
Extensions
- Have students research other data sets and compare them with the tornado Story Map data.
- Population data: Have students look at an area where a particularly devastating tornado occurred. Does population change before and after the tornado?
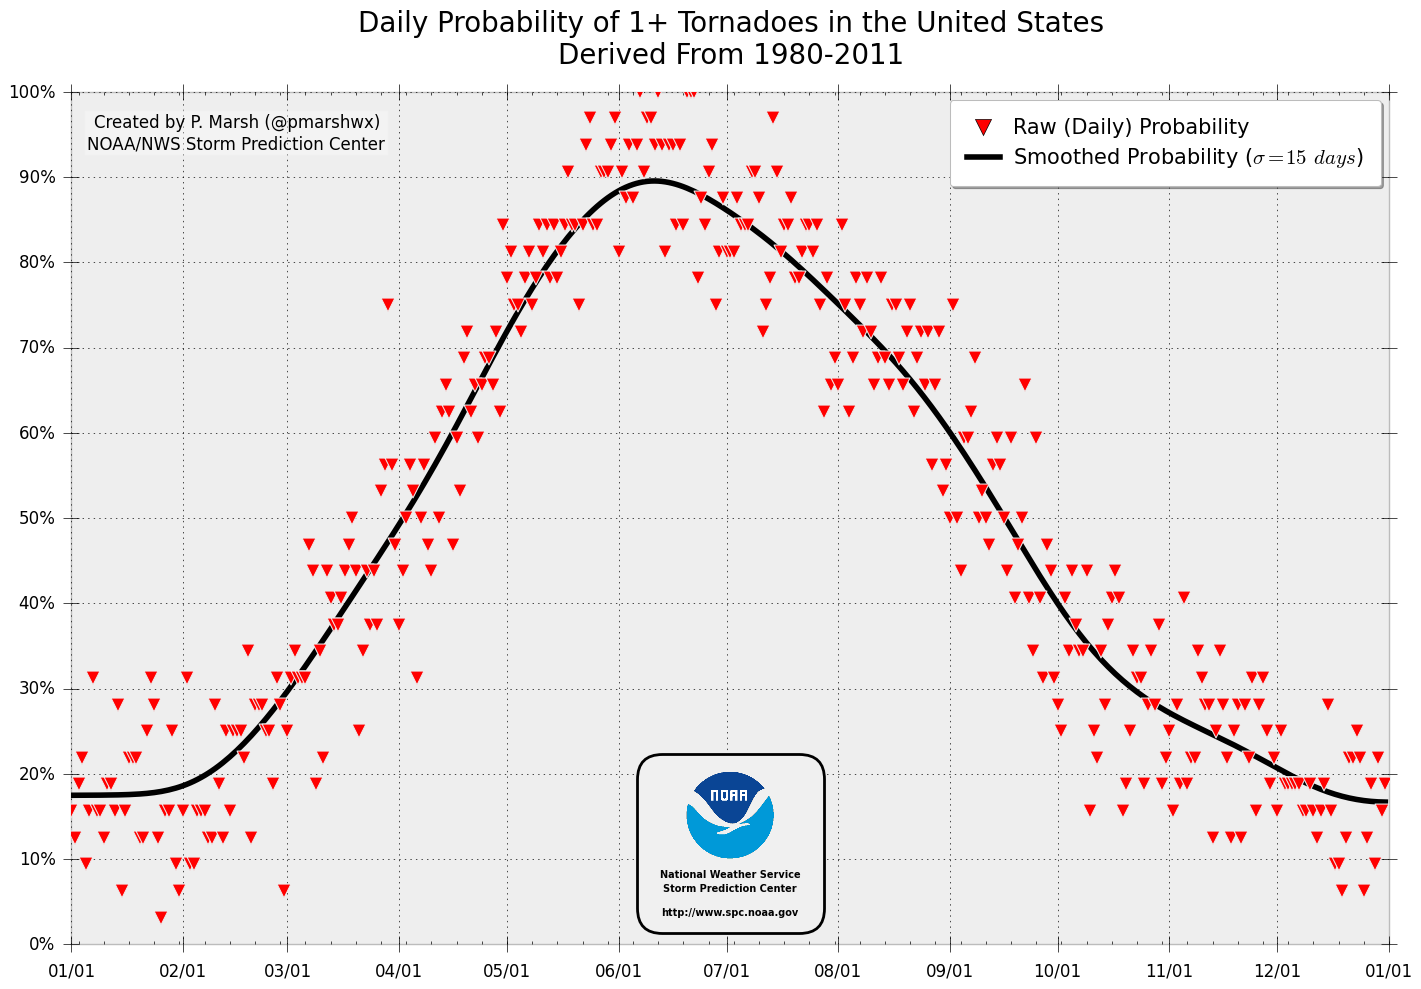
- Daily Probability of a Tornado Anywhere in U.S. Based on Past 33 Years: What was the probability of a tornado occurring, and how does it compare to the actual occurrence of a tornado?
- Have students conduct additional research about a specific tornado. Using the Internet, they can look up the time of day when it occurred, weather conditions leading up to the tornado, etc.
- National Climatic Data Center: Historical Records and Trends provides good contextual data about tornadoes, including the timing of occurrence and annual totals.
- What Role Does Climate Change Play in Tornadoes?: This Scientific American article explores the connection between tornadoes and climate change.
Assessment
Ask students to come up with three assessment questions for their classmates based on the interactive story map. You can either gather all of the questions and chose some for a written assessment, or have the students create a game for participation from the entire class.