The Mississippi River Delta
![]() This is Part 1 of Lesson 2 of Project Resilience curriculum.
This is Part 1 of Lesson 2 of Project Resilience curriculum.
Students use a simple stream table to create a model that shows how the Mississippi River delta forms. They design an experiment to test how changes to the natural system will effect delta formation.
Learning Objectives
- Students learn the definition of a watershed, which watershed(s) their community is a part of, how it formed, and how it has changed over time, both naturally and from human modifications.
- Students discover the importance of the Mississippi River watershed and create a model of the river delta using a stream table.
- Students make connections between delta formation and the land that they live on as part of a coastal community.
Materials
- Project Resilience Slide Deck (slides 8-11)
- Projector & Computer
- How a Delta Forms- Student Experiment Sheet(PDF)
- Paint tray or large baking/roasting pan with a hole at one end for water drainage (one per group)
- Large water container with a spigot (one per group)
- Access to a sink or water source
- Bucket or tub to collect water drainage
- Books, box, or extra tubs to prop up the water containers
- Graduated cylinders (100mL or larger) or liquid cup measurers
- Spray bottles
- Sand (4-5 cups per stream table)
- Timer
Preparation
- Drill a drainage hole into the bottom of each paint tray (stream table).
- Set up the stream table stations for each group, including filling water containers and adding sand to the stream tables (sand and water will likely end up on the tabletops and floors during this activity).
- Assign students to stream table groups.
- Print copies of the How a Delta Forms- StudentExperiment Sheet (one per group)
Note: Only sand will be used in the paint trays during Part 1.
Directions
Introduce the Mississippi River Watershed (5 min)
- Introduce students to the importance of the Mississippi River while showing the Rivers of the Mississippi Watershed visualization (slide 9)
- Ask students to make observations about the watershed video: What do you notice? What do you think a watershed is? Why is this important for where we live in coastal Louisiana?
- Define a watershed, also called a drainage basin or catchment, as the entire area (including tributary rivers) that drain into a single river. The Mississippi River watershed covers 41% of the lower 48 states.
- Share some facts about the Mississippi River:
- It is the second longest river in North America (the Mississippi-Missouri-Jefferson river system is considered the longest continuous river in North America).
- It is the largest drainage basin in the United States.
- The coastal land many people live on wouldn’t be here if it weren’t for the river.
- Pose the question: How might the Mississippi River and its watershed have created the land we live on today? Have students brainstorm ideas in pairs, then share out some ideas with the whole class.
Model How a Delta Forms (25 min)
- Introduce that coastal Louisiana residents live on land formed from sediment transported by the river and deposited where the river meets the ocean--the delta!
- Note: areas on the west side of the delta are now estuarine, which students will explore in Part 2.
- Show the set-up of the stream table and explain that we will use this as a model for how a delta forms.
- Point out that we will be creating a very simple model, while the actual delta system is much more complex (influenced by tides along the coast, not just water flowing out of the river, for example).
- Ask students to brainstorm different variables they could test that might affect how the delta forms (the volume of water, speed of the water, angle of incline, diverting water, etc.). Record a list of variables on the board.
- Break students into small groups (four or five students, depending on class size and materials available), and pass out a copy of the How a Delta Forms- Student Experiment Sheet to each group.
- Assign each group to test out a different variable from the list on the board.
- First, each group will need to plan how they will conduct their experiment and what observations they will record.
- Remind students that if they are experimenting with volume and velocity, they will need to measure the amount of water that passes through the stream table and the amount of time the water takes to flow.
- Then, instruct them to follow the instructions on the experiment sheet to set up the stream table to create a delta.
- For Trial 1, groups should flow water through the stream table for at least five minutes, recording observations each minute.
- For Trial 2, groups should flow water through the stream table with different conditions to test their variable (changing the amount of water that they allow to flow through, or changing the amount of time, etc.).
Note: students may enjoy recording a time-lapse video of their stream table experiment, or taking photos.
Stream Table Investigation: Forming a river delta
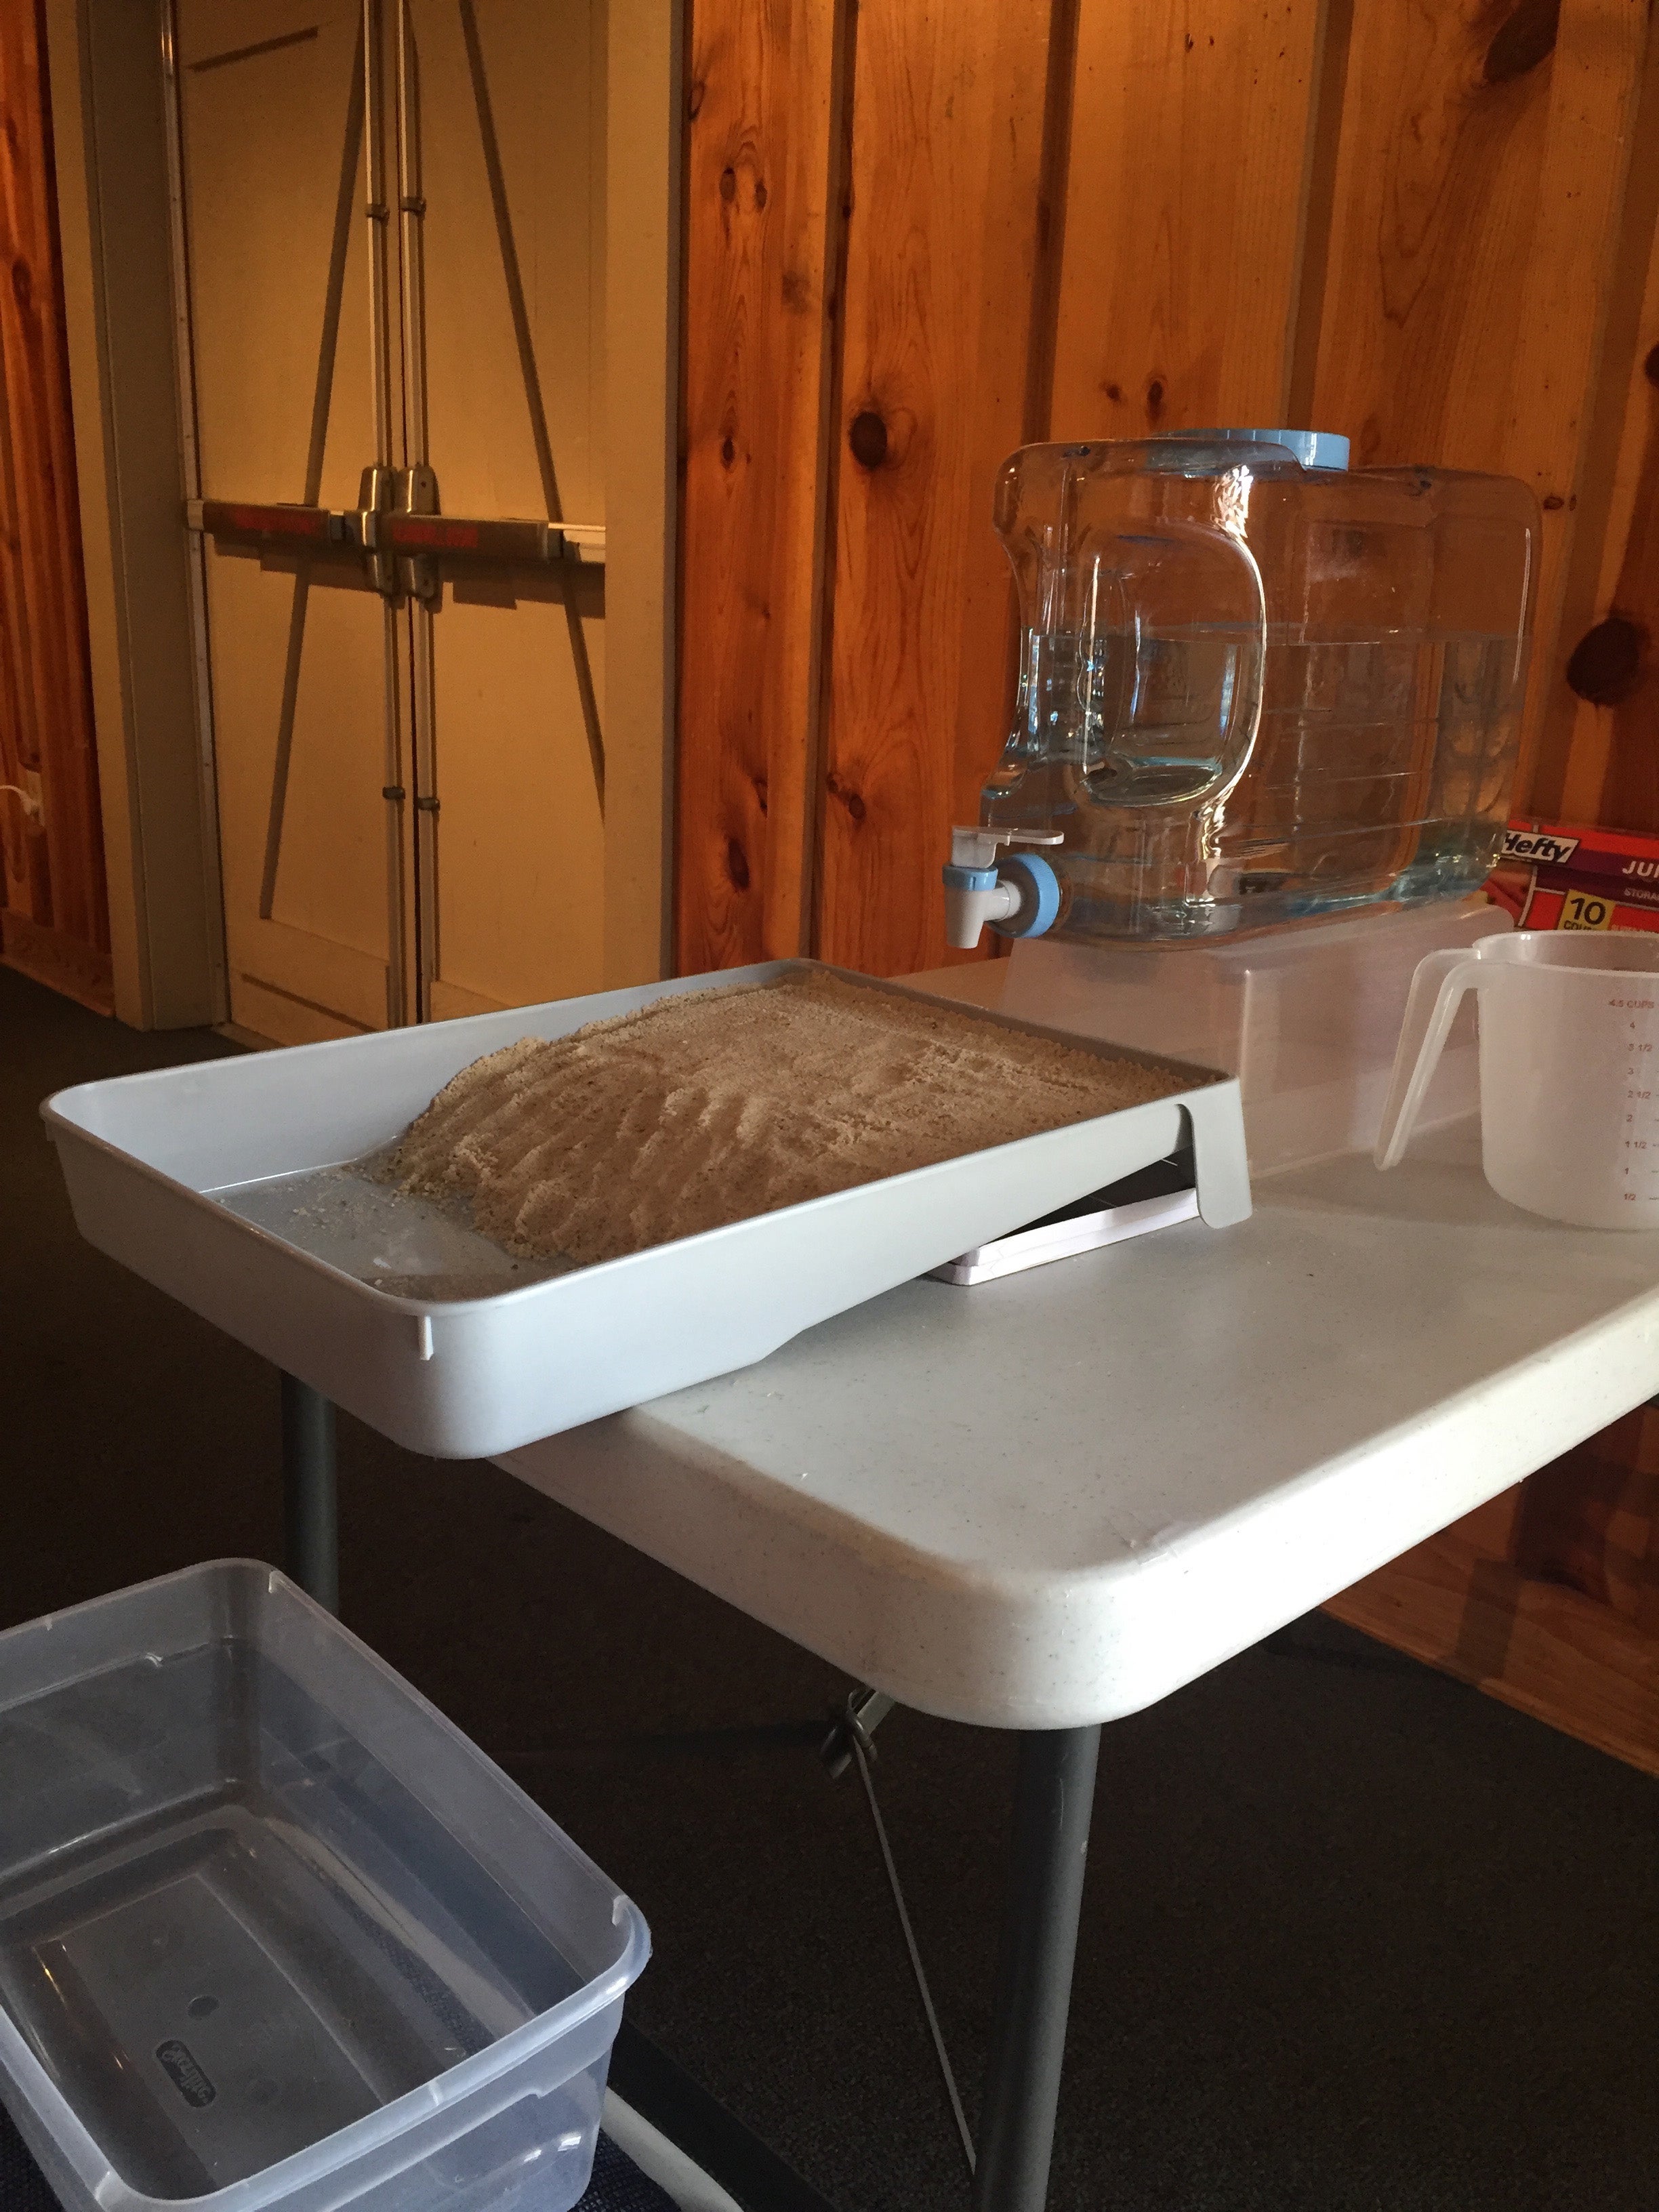
Photo 1: Suggested set up for the stream table investigation. Access to a sink or source of water will allow students to refill their water containers as needed. Students can change the angle of incline, the rate of flow of water into the stream table, the volume of water they allow to flow through the stream table, etc.
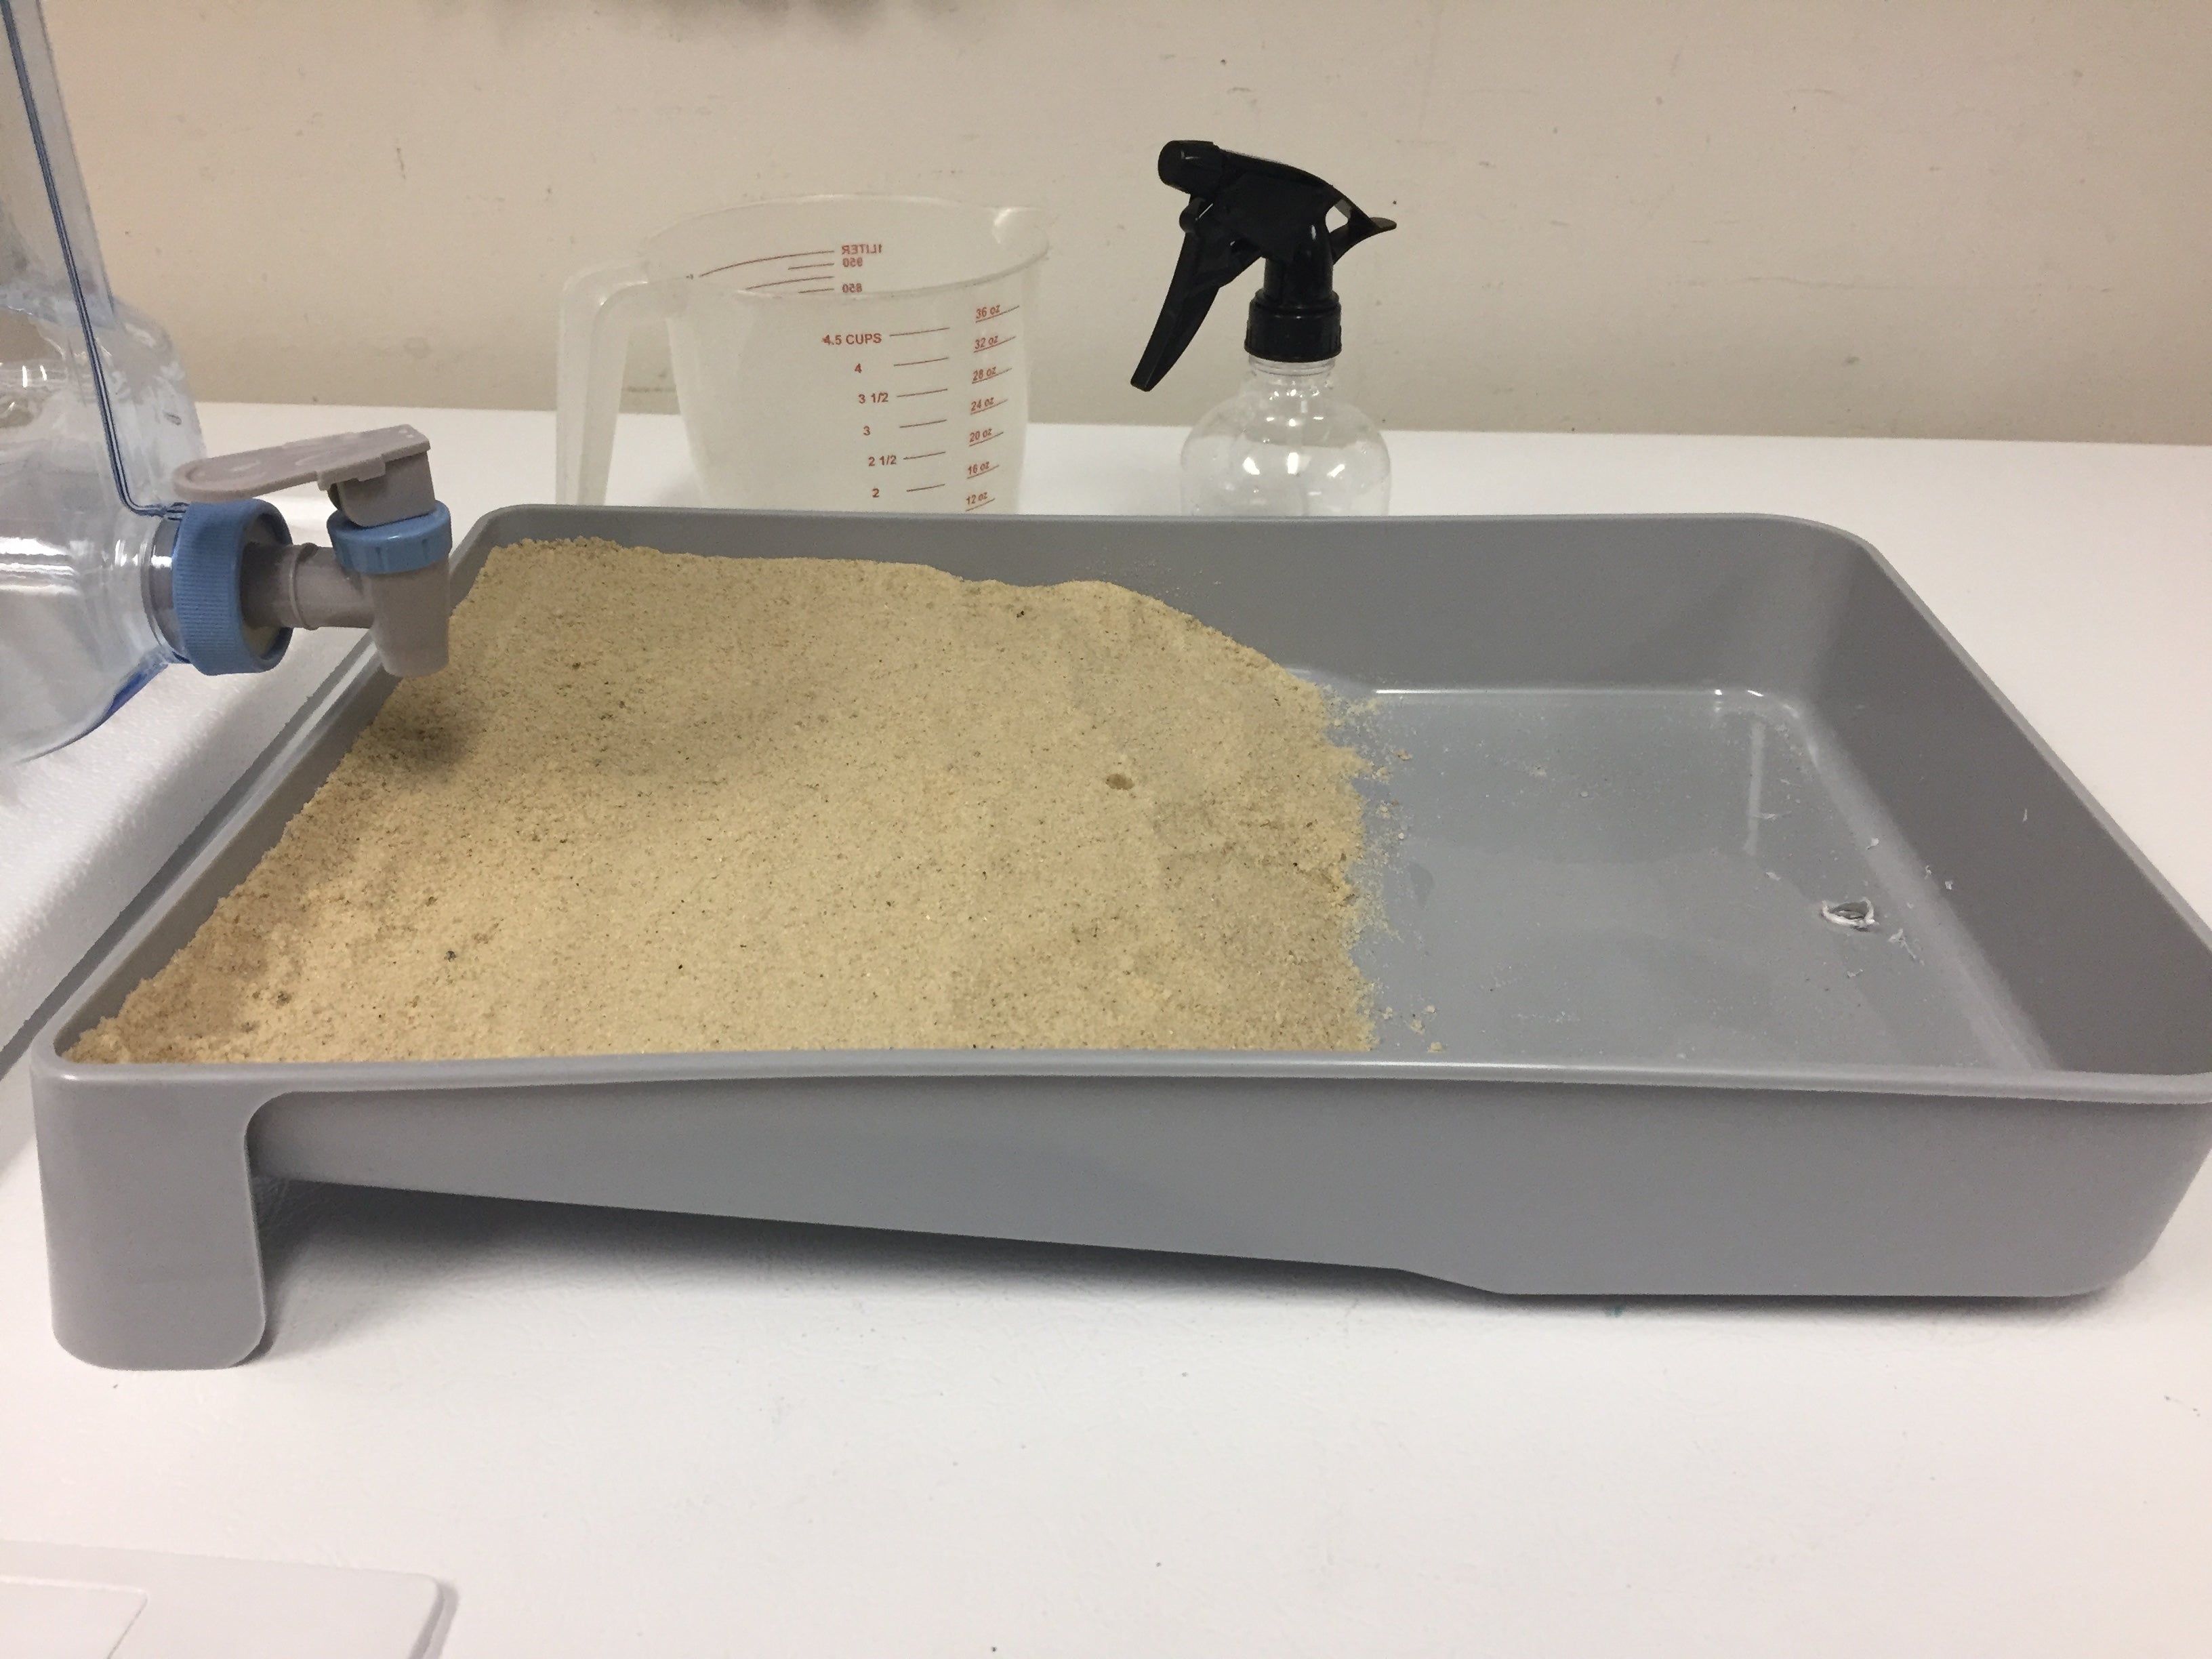
Photo 2: Press about 1 inch of sand into the upper half of the stream table, leaving space for the delta to form in the bottom half of the tray. The 4.5 cup/36 oz measuring cup is a good estimate of the amount of sand needed per sand table. Wet the sand with the spray bottle before beginning the flow of water. Note the drainage hole at the bottom, which you will need to drill out prior to facilitating the lesson.
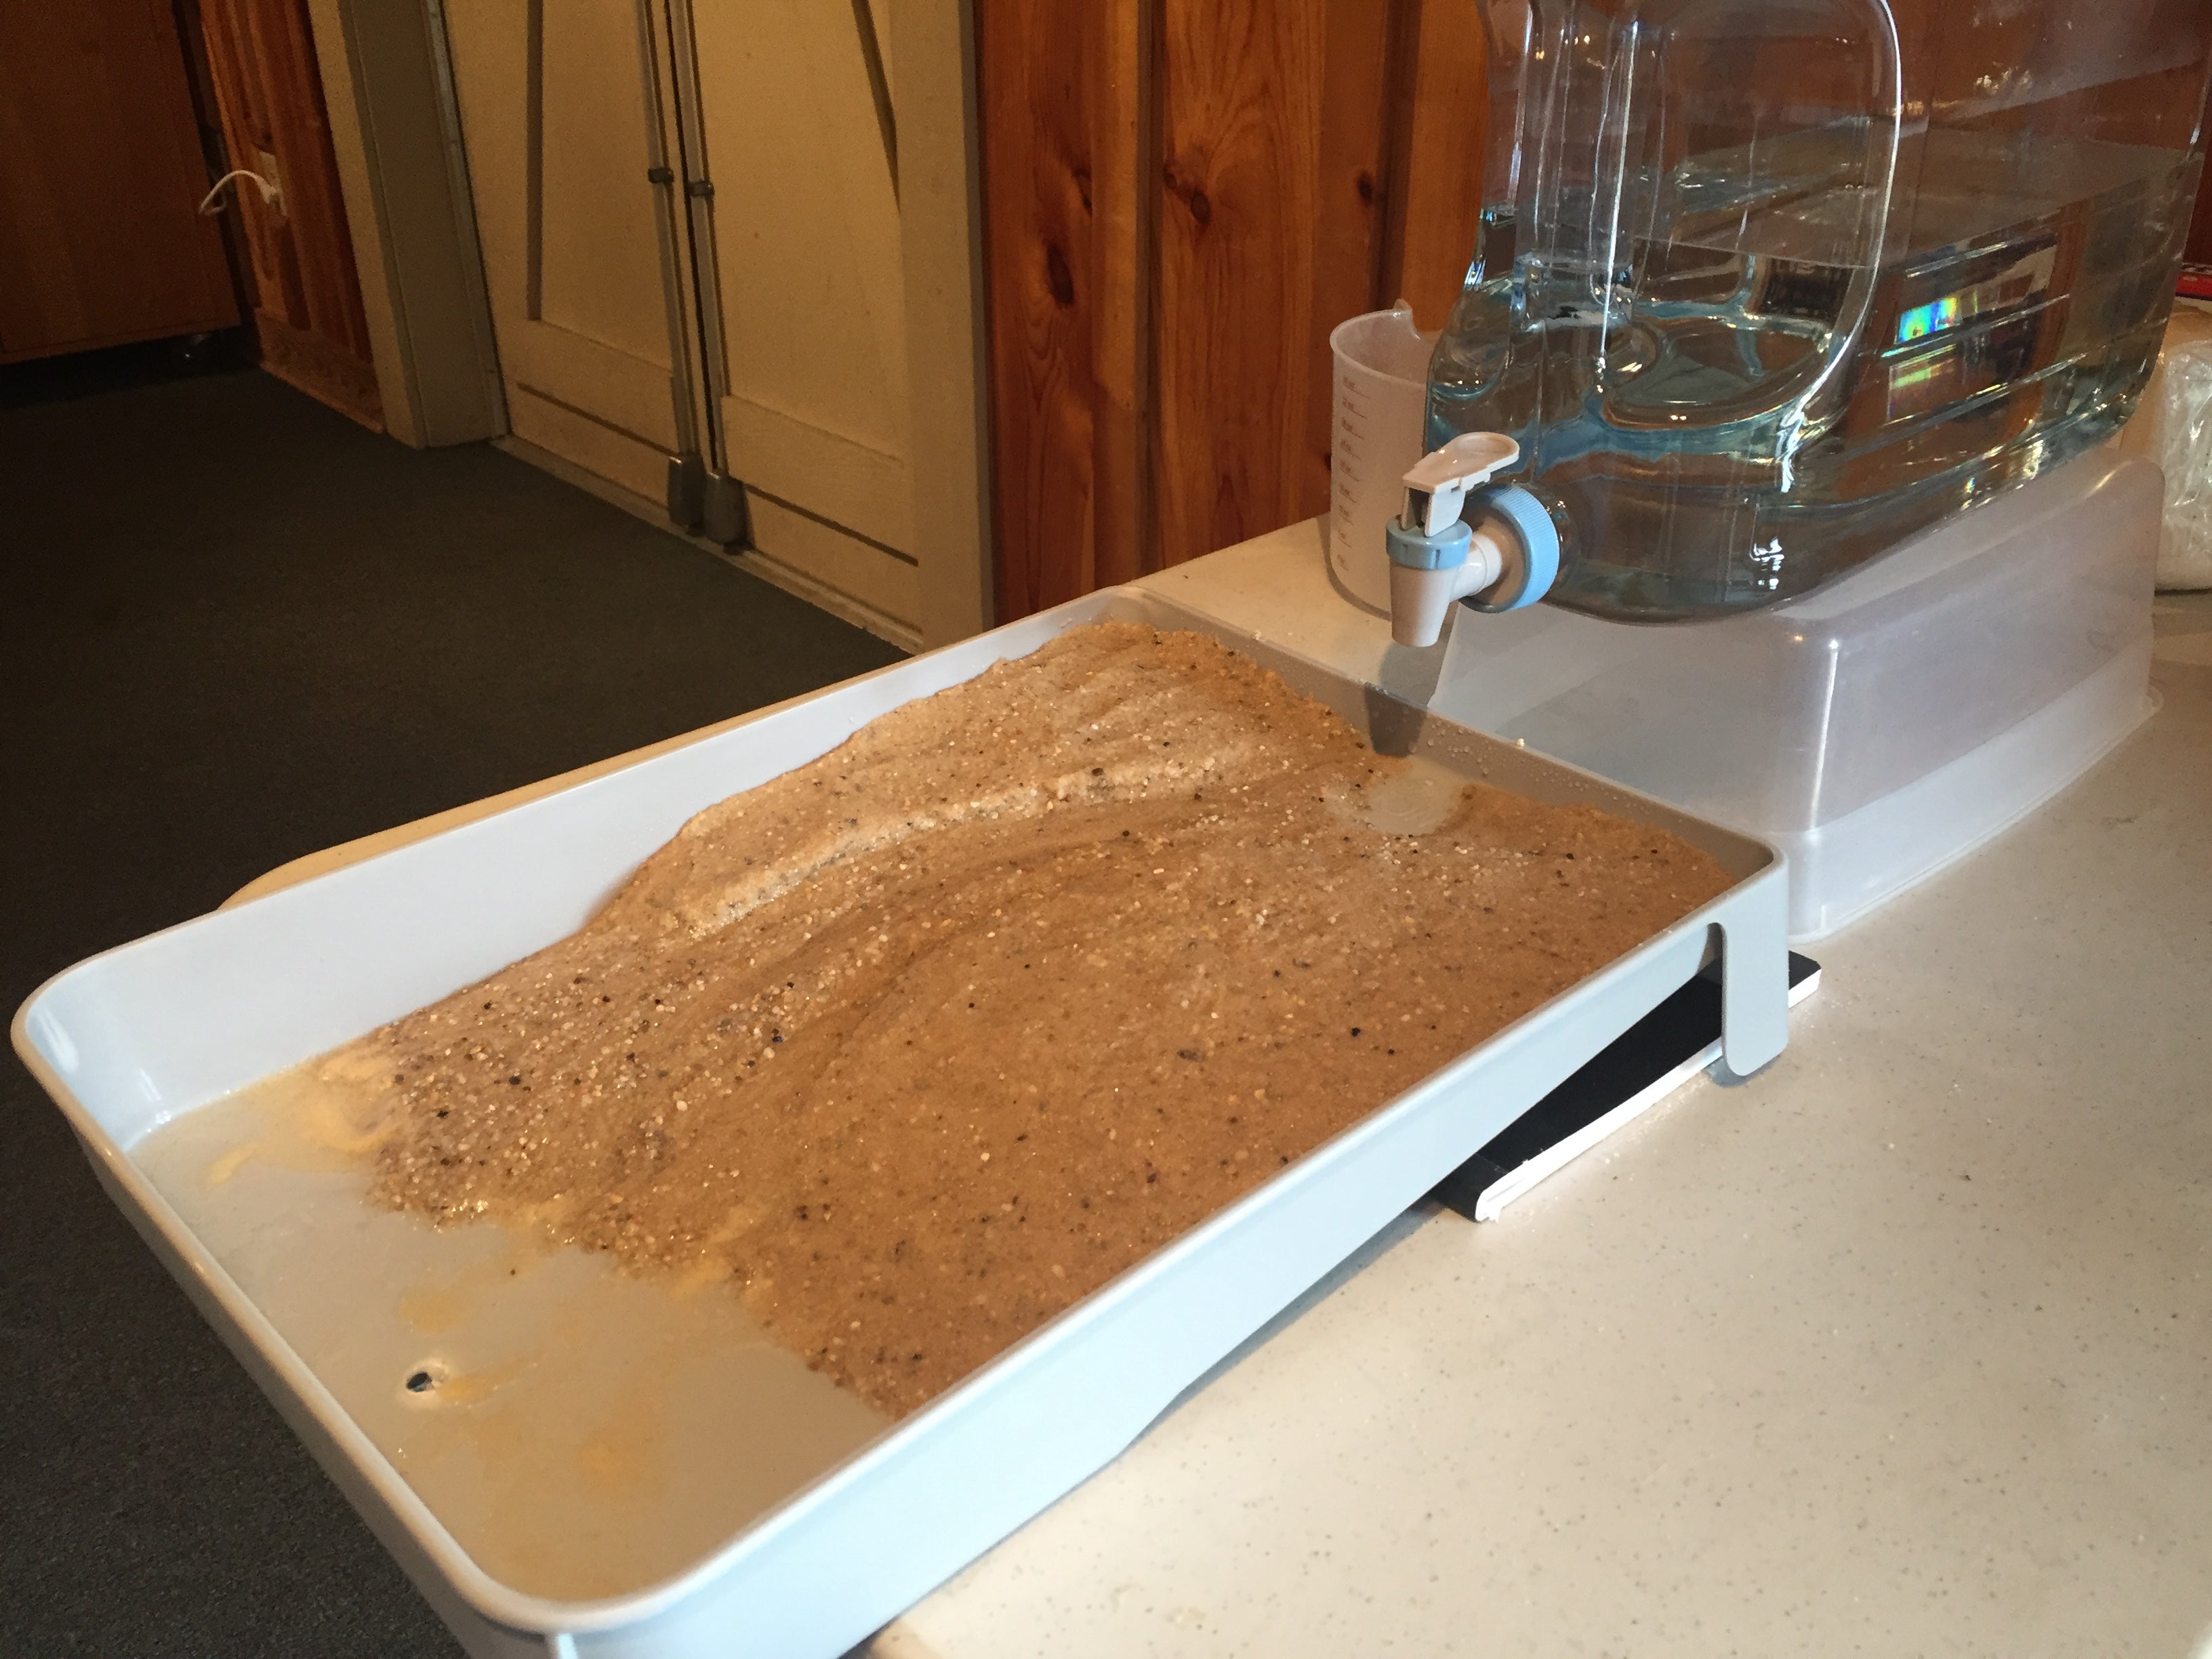
Photo 3: As the delta forms, look for features such as a “birdsfoot” delta and braided streams.
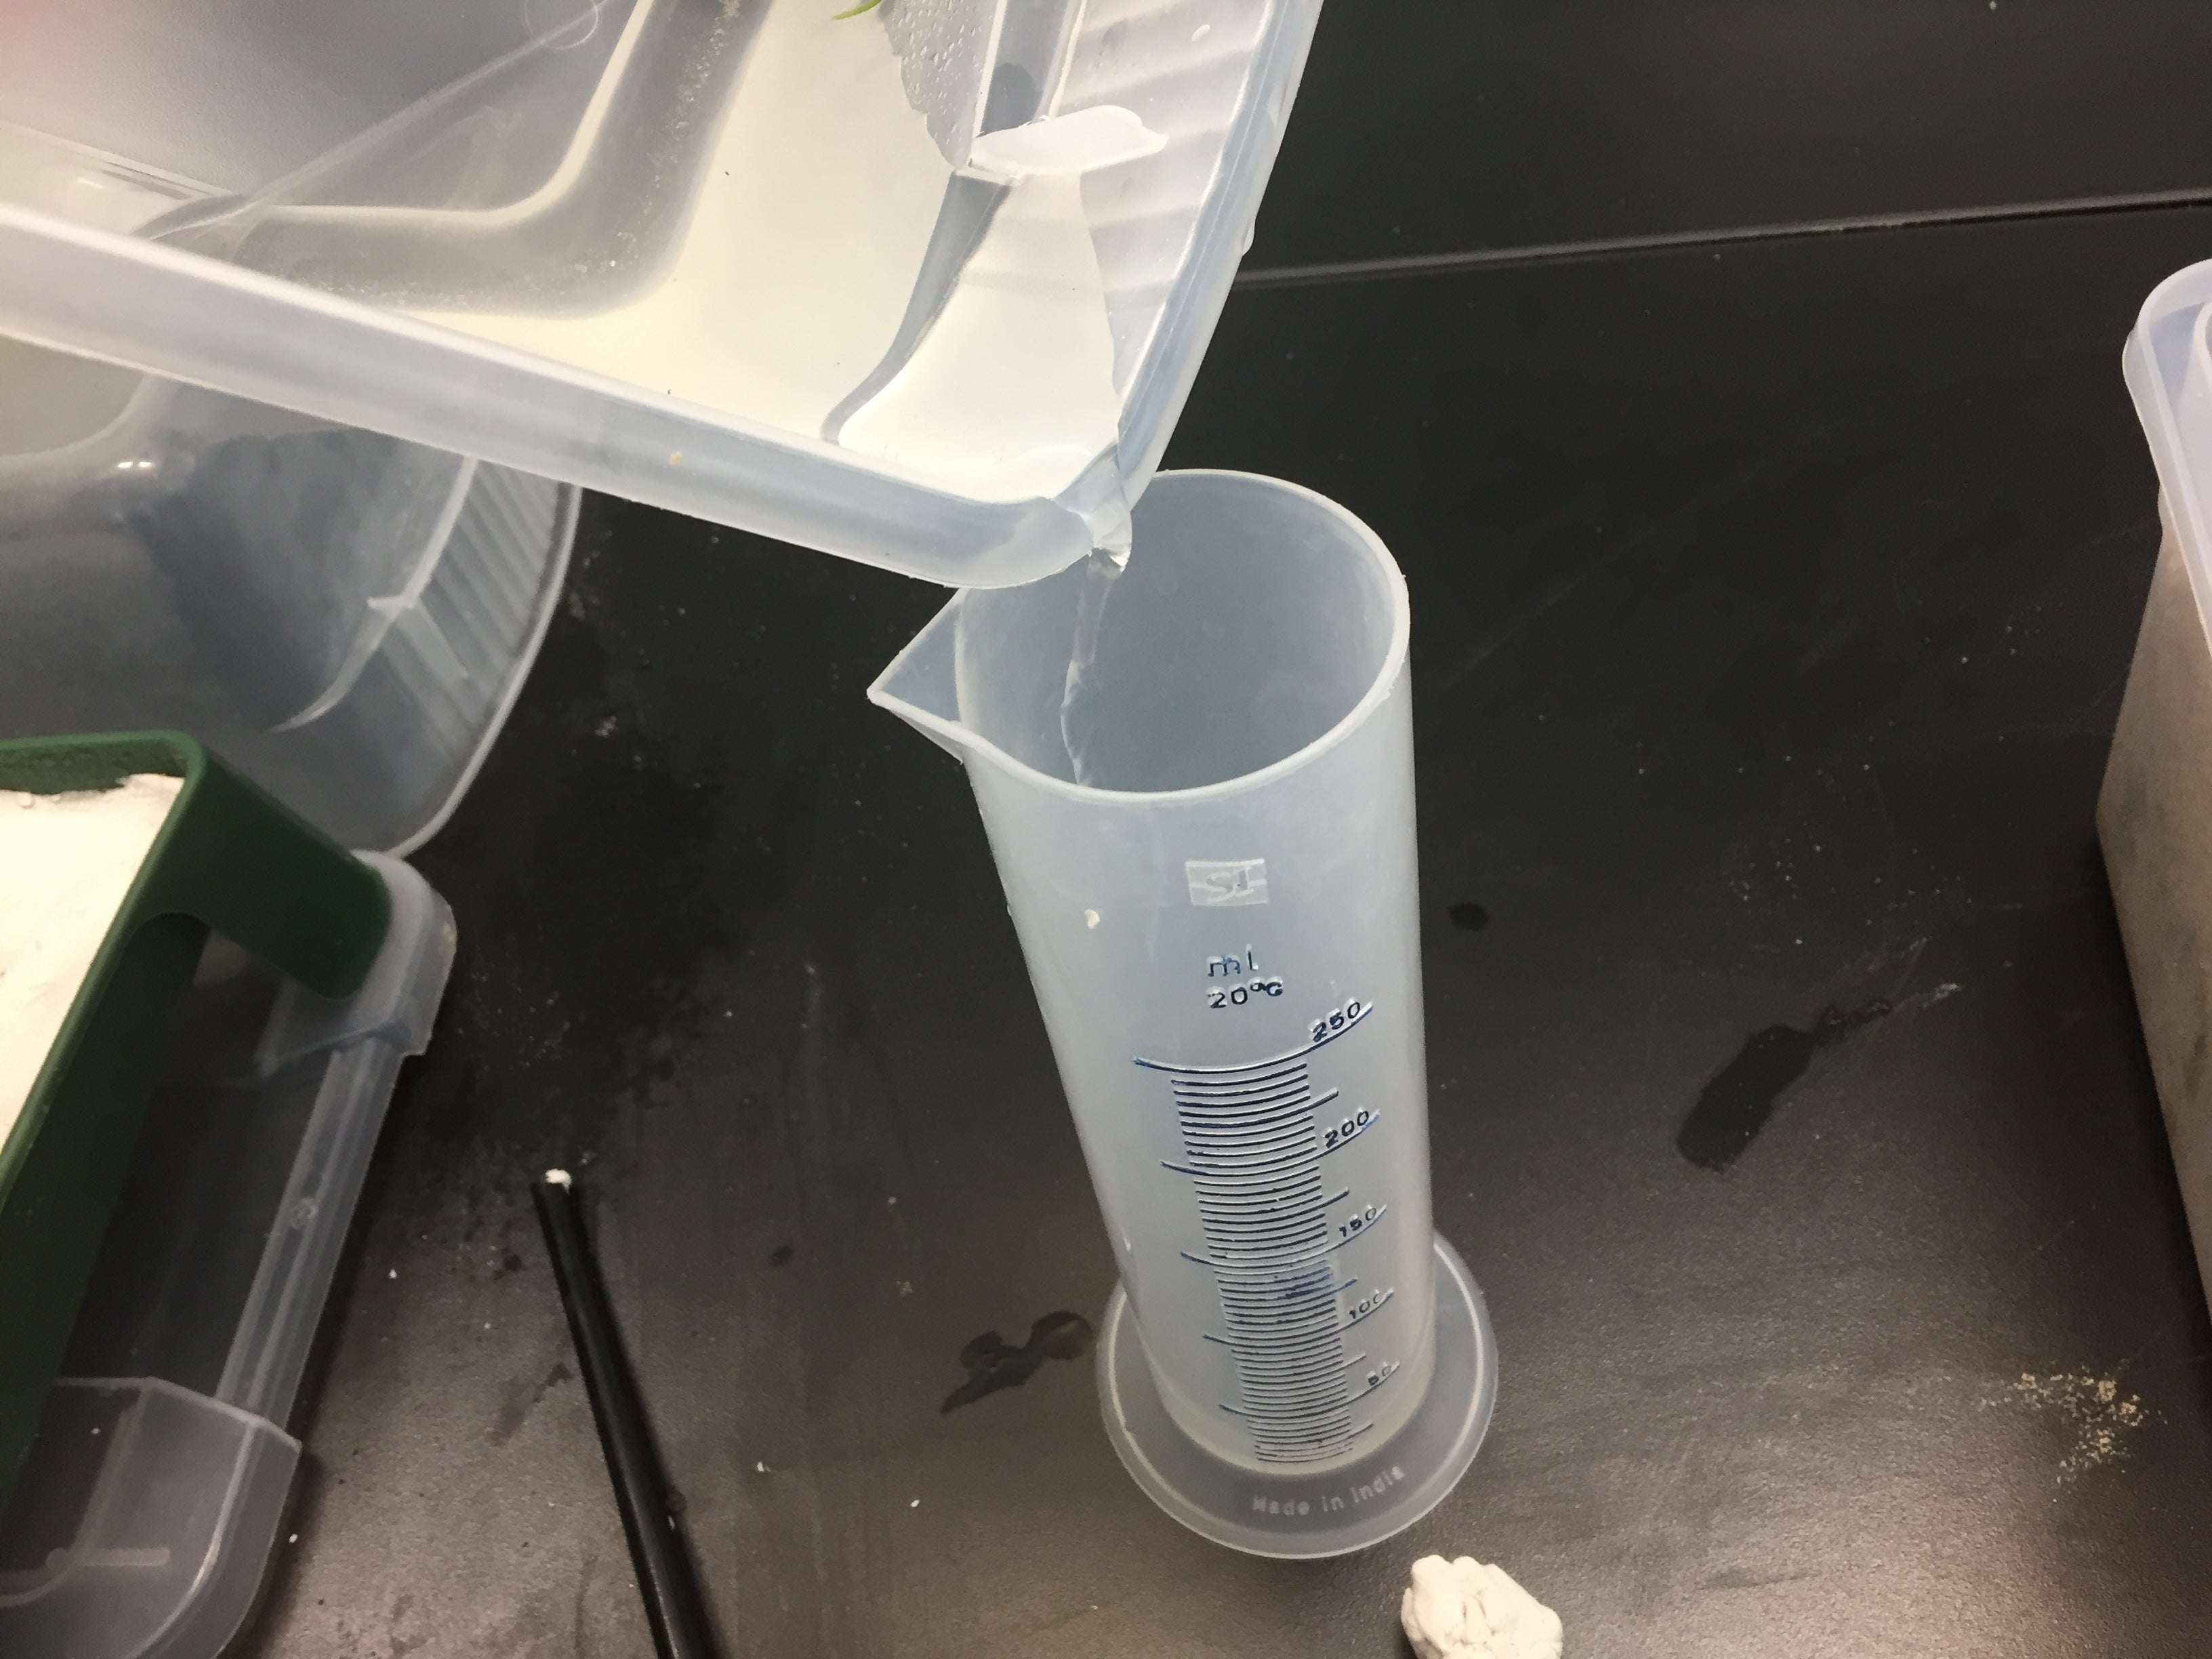
Photo 4: Measuring the volume of water that flows through the stream table and recording the amount of time it took to flow through can provide water velocity data.
Facilitation Tips:
- Fill the top half of the tray with sand, leave the rest of the tray empty. The drainage hole should be at the bottom of the tray.
- Prop the top of the tray up with a book/blocks/etc., so that the tray sits at an incline.
- Wet the sand before you add the river.
- Position the water container above the sand at the top of the tray. This will represent the headwaters.
- Allow water to flow onto the sand as a slow but steady stream. If you are using a spigot, you can easily control how much water flows into the stream table.
- Begin recording the time when you start the flow of water if you will be making velocity calculations.
- Calculate water volume by measuring the amount of drainage water with a graduated cylinder (velocity=volume/time).
- Observe the stream tables for at least 5minutes, or until delta features are visible.
- Circulate among the groups while they are experimenting with the stream tables, focusing attention on the delta and changes to the river channel. Pose questions such as:
- What do you see happening? How is the river changing?
- Compare experiments. Have each group share to debrief the stream table experiments. Make connections between these variables and things in the real word (flooding, building levees, etc.). Use the following prompts to guide your discussion:
- Did anyone see the beginning of “birdfoot” like features in their stream tables?
- What happens to delta formation when the water velocity changes? How might this happen in real life?
- Where does the sediment that forms the Mississippi River delta come from?
- How well do our models represent the real delta? What are the limitations of our model?
Wrap up- Connecting Our Models to the Mississippi River Delta (10 min)
- Show the Restoring America’s Deltas video segment about Delta Formation, from start to 4:46min (the video link is below, and also in slide 10). As students watch the video, have them write down any connections they notice between their stream tables and the video.
- After watching the video, hold a short discussion. Show the image of the delta lobes (slide 11) as students discuss. This image shows how the location of the Mississippi River delta has changed over time. Use the following prompts:
- How does what the video showed compare to what we saw with our stream tables today?
- How has the Mississippi River delta changed over time?
- How is the history of delta formation important for coastal Louisiana?
Restoring America’s Deltas (video)
https://www.youtube.com/watch?v=wWRGvGv1vps
The following time designations will help you navigate to appropriate sections of the video. While not all sections are specified in the curriculum, you may decide to include them as extension activities.
0:00-4:46 Delta Formation (aligns with Lesson 2: Part 1)
4:46-10:22 Diversity in Marshes (aligns with Lesson 2: Part 2)
10:28-15:00 Mississippi River Economy and Ecosystem Services (aligns with Lesson 2: Part 2)
15:12-19:20 History of Hydrologic Modification (aligns with Lesson 2: Part 3)
19:23-24:19 Solutions: Sediment Diversion and Re-forming the Delta (aligns with Lesson 2: Part 4)
Clean Up (10 min)
- Use the remaining class time to have students clean up the classroom.
Assign Journal Prompt #2.
- Prompt 2: In today’s lesson, you learned about how important the river was in the formation of the land you live on. Think about a natural area or specific place in coastal Louisiana that is special to you. Describe the place and share what you like about it. From your understanding of how the Mississippi River Delta has changed over time, explain how this area might have formed.
Background
Excerpt below from The Louisiana Coastal Wetlands Planning Protection and Restoration Act Program
The Mississippi River Delta Basin
"The Mississippi River has had a profound effect on the landforms of coastal Louisiana. The entire area is the product of sediment deposition following the latest rise in sea level about 5,000 years ago. Each Mississippi River deltaic cycle was initiated by a gradual capture of the Mississippi River by a distributary, which offered a shorter route to the Gulf of Mexico. After the abandonment of an older delta lobe, which would cut off the primary supply of fresh water and sediment, an area would undergo compaction, subsidence, and erosion. The old delta lobe would begin to retreat as the gulf advanced, forming lakes, bays, and sounds. Concurrently, a new delta lobe would begin its advance gulfward. Over the past 5,000 years, this deltaic process has caused the coastline of south Louisiana to advance gulfward from 15 to 50 miles, forming the present-day coastal plain.
"For the last 1,200 years, sediment deposition has occurred primarily at the mouth of the Mississippi River’s Plaquemines-Balize delta, in the area defined as the Mississippi River Delta Basin. This delta is located on the edge of the continental shelf of the Gulf of Mexico. Its bird’s foot configuration is characteristic of alluvial deposition in deep water. In this configuration, large volumes of sediment are required to create land area. Consequently, land is being lost in this delta more rapidly than it is being created.
"The Mississippi River Delta Basin comprises approximately 521,000 acres of land and shallow estuarine water in the active Mississippi River delta. Approximately 83 percent of this area, or 420,000 acres, is open water. The 101,100 acres of land in the basin is characterized by low relief, with the most prominent features being natural channel banks and dredged material disposal areas along the Mississippi River, its passes, and human-made channels. Coastal marshes make up approximately 61,650 acres or about 61 percent of the total land area in the Mississippi River Delta Basin. Eighty-one percent of this marsh is fresh, 17 percent is intermediate, and 2 percent is brackish-saline.
"The Mississippi River discharges the headwater flows from about 41 percent of the contiguous 48 states. On a long-term daily basis, discharges in the Mississippi River average 470,000 cubic feet per second (cfs). A peak discharge of approximately 1,250,000 cfs occurs on the average of once every 16 years downstream of New Orleans."
Mississippi River Delta Basin formation and land loss:
“Between 1974 and 1990, the land loss rate in the Mississippi River Delta Basin averaged 1,072 acres per year, or 1.69 percent of existing land area (Dunbar, Britsch, and Kemp 1992). Between the mid-1950s and 1974, the estimated land loss rate for the basin was 2,890 acres per year. This loss is the result of compaction, subsidence, hurricanes, tidal erosion, sea level rise, and human activities. The loss has been aggravated by the maintenance of navigation channels and the construction of canals for mineral exploration. The total land area lost in this basin over the last 60 years has been approximately 113,300 acres.”
Part 1 Extensions
Use the Our Coastal Crisis website to extend your exploration of the Mississippi River Delta
- To extend learnings about how the delta formed, read How the Delta Formed and then answer the questions:
- How has the Mississippi River changed over time?
- What is the historical significance of the delta for New Orleans?
- What challenges to the natural cycles is the delta experiencing today?
- Examine and discuss the image of the delta lobes on the How the Delta Formed page:
- Point out time (the lobes represent the location of the delta from the distant past).
- Why are the lobes significant? Where might you expect the next lobe to form if the natural cycles were allowed to progress?
- Point out that this no longer happens because the river is modified so that the channel does not change location.
- What are the pros/cons of this hydrologic modification?
- Point out time (the lobes represent the location of the delta from the distant past).
- To learn more about the structure of a river delta, read and discuss the Anatomy of a Delta page on the Coastal Crisis website.
- Return to the stream tables and look for the features described in the Anatomy of a Delta as students allow water to run through their model. Label these features on the stream table, or sketch them on paper.
Related Resources

Credits
This activity was developed for Project Resilience, funded by the Gulf Research Program of the National Academies of Sciences, Engineering, and Medicine.