Rain Measurements Tell a Story
Students explore rainfall data and learn how to measure precipitation through an interactive story.
Learning Objectives
- Students will learn how to measure rainfall using a rain gauge.
- Students will explore the data from an unusual rainfall event in Boulder, Colorado.
Materials
Rain Gauge
CoCoRaHS
- Rain gauge (similar to the types used by CoCoRaHS and the GLOBE Program)
- Rulers
- Seven containers for water
- Water
- Tarp (if you are doing this activity inside)
- Data table (See below.)
- Pencils and paper for recording measurements
- Graph paper and colored pencils
- Internet access and a projector for introduction videos
Preparation
Preview the videos from CoCoRaHS and familiarize yourself with using a rain gauge.
- Measuring Precipitation Video: from minute 1:03-1:37 to get an overview of how to measure the amount of rainfall using a rain gauge.
- Measuring Extreme Rainfall Video: first two minutes so that students know how to measure more than one inch.
Measure amounts of water into the seven containers for each day of the story using the rain gauge (see rainfall data table below) and label each container with the day.
Print one copy of the Rain Gauge Story. Laminate each page if you plan to use it more than once.
Directions
1. Introduce students to the rain gauge.
Ask students to imagine what it would look like if all the water that fell during a rainstorm stayed where it fell and did not soak into the ground or flow into a river. What depth of water would cover the ground? Would it cover your shoes? Explain that the rain gauge measures the amount of water that falls during a rainstorm in inches so that we know how much water fell to the ground.
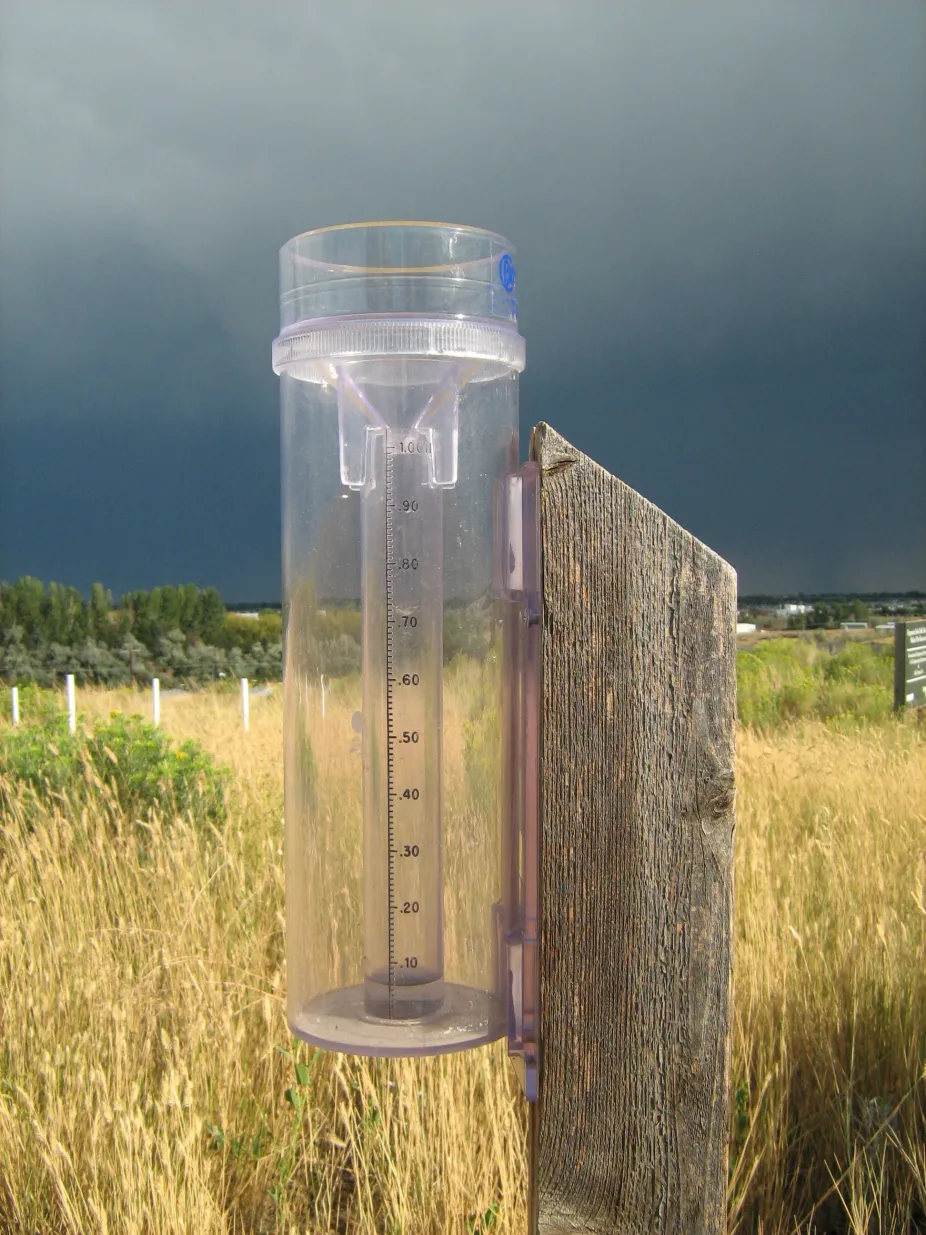
2. Demonstrate how to read a rain gauge.
Explain that water is funneled from a wider area into a narrower area in the gauge, so the measurement scale on the inner tube is enlarged and an inch of rainfall looks much larger. You can demonstrate this by pouring less than one inch of water into the outer cylinder, measuring the depth with a ruler, and then pouring the water into the inner cylinder, which should measure the same amount even though it will appear much deeper.
Ask students to hypothesize what would happen if there were more than one inch of rainfall. Pour water into the gauge so that it overflows the inner tube. Show students how to measure the water in the inner tube and then the water that spilled over into the outer tube and add the numbers. Play the two CoCoRaHS video segments.
3. Read the rain gauge story and measure the rainfall day-by-day.
Select eight students to each read one chapter of the story to the class. (With younger students, plan to read the story to students.) After each student reads a chapter, fill the rain gauge with the water you pre-measured for that day of the story and have one or two students read the gauge. After the students have measured the water for that day, empty the rain gauge and then read the next chapter.
For days during the story when there was more than an inch of rainfall, students will need to follow these steps:
- Measure the amount of water that is in the inner tube and record the number.
- Remove and empty the inner tube.
- Place the funnel on the top of the inner tube and pour the water from the outer tube into the inner tube.
- Measure the remaining water in the inner tube and record the number.
- If there is still more water in the outer tube, repeat steps 2‐4 until there is no more water to measure.
- Add all the numbers together to get the rainfall total for that day.
Classroom management: Have all students record the data while one or two students are reading the gauge. Invite a new pair of students to read the gauge for each day of the story. For Thursday’s rain gauge reading (8.43 inches of water), numerous students can get involved with measuring because the inner tube will need to be measured and emptied at least nine times. Students will have many numbers to add to find that day’s total rainfall.
4. Graphing the data
Below are the rain gauge measurements, made by Bill Schmoker at Centennial Middle School in Boulder, Colorado, during the extreme rainfall event in September 2013. To the right of each measurement is the amount rounded to the closest half‐inch. You may wish to have students explore the rounded data depending on math skills. Have students construct a bar graph with inches on the y-axis (vertical) and date on the x-axis (horizontal).
For a more simple graph of the data, have students fill seven empty soda bottles with the number of inches of water that were measured, place in order of the date, and take a photo or draw a picture.
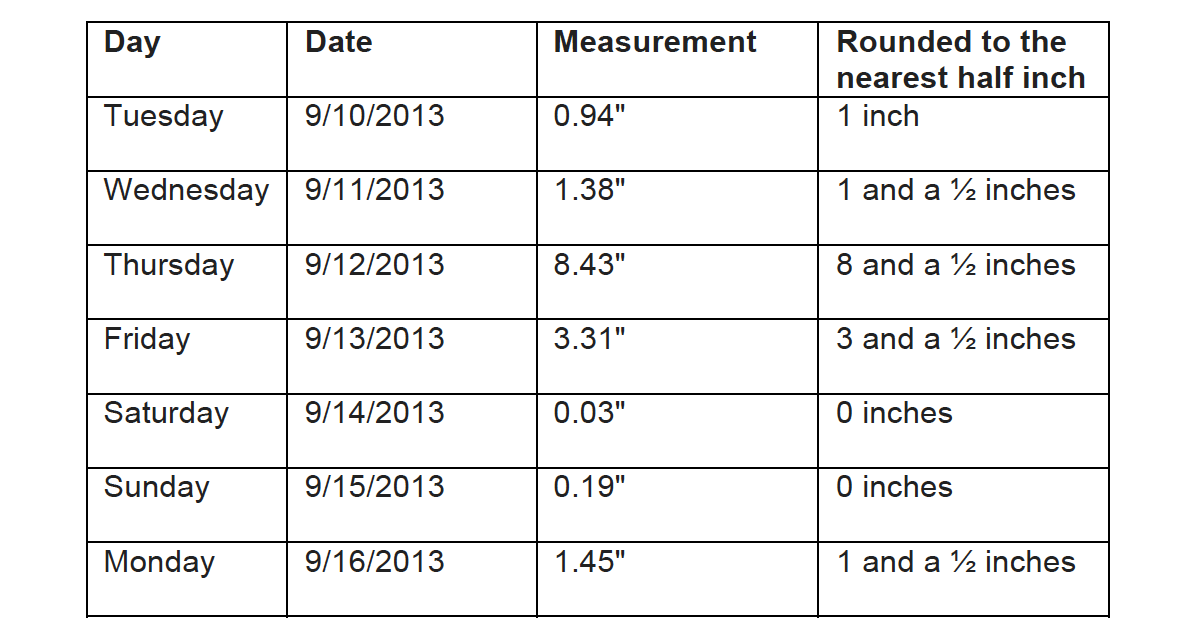
Rainfall data collected by Mr. Schmoker at Centennial Middle School in Boulder, Colorado, during the extreme rainfall event in 2013.
Credit: CoCoRaHS measurements, UCAR data table
Adaptation for younger or older students
- With younger students, focus on relative amounts of water in the rain gauge (i.e., more or less than the day before). With older students, emphasize accuracy in measurement (reading the gauge to the hundredth of an inch).
- To include literacy skill-building, have students read each story card aloud to the rest of the class. If you have multiple rain gauges available, you may wish to have student groups each work on a different day of the story and then present their day and the rain gauge data to the class.
- Extend learning for older students by taking your own daily precipitation measurements. Get involved with CoCoRaHS or the GLOBE Program and share your school’s data with others.
Background
About Measuring Rainfall
Rain is often measured once in each 24-hour period using a rain gauge that has two cylinders – a narrower one inside a wider one. A funnel collects the rain into the narrower cylinder, which "magnifies" it, allowing one to read rainfall amounts as small as one-one-hundredth of an inch. For more information about reading a rain gauge, visit How to Read Your Rain Gauge on the website of the Community Collaborative Rain, Hail and Snow Network(CoCoRaHS).
About the 2013 Extreme Rainfall Event in Boulder, Colorado
An unusually wet rainstorm stalled over north-central Colorado from September 9-16, 2013. Rain flooded numerous narrow valleys in the Colorado Front Range, flooding waterways to the east of the Rocky Mountains and causing significant damage. The National Weather Service has calculated that the probability of a rainfall event so large was one in 1000 in this region.
Volunteers with CoCoRaHS, including science teacher Bill Schmoker at Centennial Middle School in Boulder, Colorado, measured storm rainfall totals of 15 to 20 inches. Bill Schmoker's data are used in this activity. He recounted his story of measuring rainfall to Lisa Gardiner at the UCAR Center for Science Education, who wrote the story that students read in this activity.