Satellite Storm Search
Students investigate a physical model to explore how satellite data impacts weather monitoring and forecasting.
Learning Objectives
Students will understand how spatial resolution of weather data affects what meteorologists know about current weather, and their ability to make predictions and issue weather warnings.
Materials
For each group of four students:
- Clear plastic shoebox
- Rice, sand, dry lentils, or other material to fill the box
- About 10 Legos, 5 Duplos or other building bricks
- Duct tape or double-stick tape
- A thin rod such as a bamboo skewer
- Marker
- Masking tape
- Two copies of the Hawaii and Pacific Map (PDF)
- Colored pencils
- Ruler (optional)
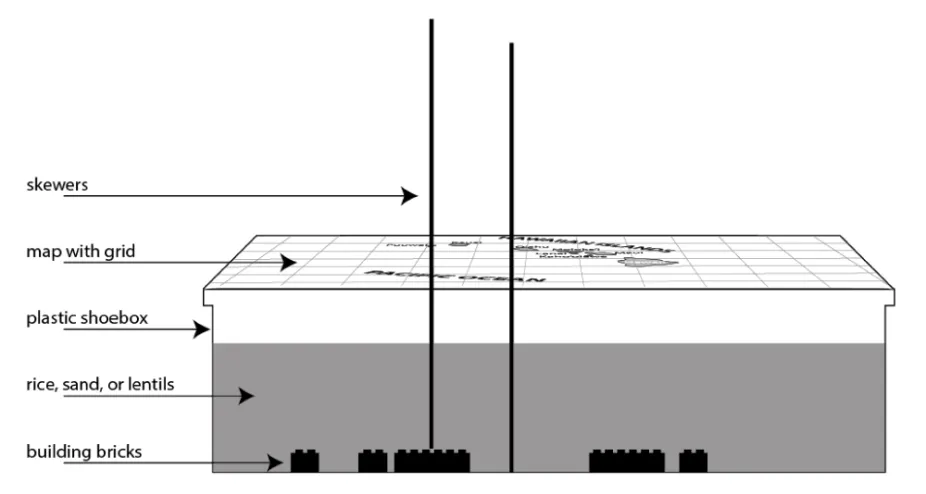
Setup for the Satellite Storm Search activity
UCAR
Preparation
Prepare the plastic containers by building shapes out of Legos, placing the shapes in the containers, and adding duct tape or double-stick tape to hold them in place. Cover the bricks with sand or rice, and then cover the top of the box with the map. Use masking tape to secure the map in place. (see cross-section of set-up above.)
Directions
Introduce the activity.
- Tell students about the intense thunderstorms that happened in Hawaii on April 14-15, 2018. During this event, more rain fell on the Hawaiian Islands than ever recorded from a single storm. Homes were flooded, cars were washed away, and a herd of buffalo was washed out to sea. (See Extension 2 for more information about these storms.)
- Have students brainstorm how storms are hazardous for people on land and for ships traveling in the Pacific Ocean which are affected by the wind and waves created by the storm. Tell students that meteorologists issue warnings to help people prepare for and stay safe from storms.
- Weather data are used to determine where people are in harm’s way. The data can be added to weather models to make forecasts more accurate, and to help people prepare for weather events. Weather data are collected in many ways (weather stations on land, weather balloons, dropsondes, and satellites). The amount of data collected is important. Scientists don't know what's happening in the atmosphere when there are places that have no weather data.Over the ocean, most of the weather data is collected by satellites.
- Tell students that in this activity, they will explore weather from the point of view of a satellite, looking down on the atmosphere from above.
Orient students to the model.
- Show students one of the boxes. Tell them that this is a model of a section of the atmosphere.
- The top of the box is at a high altitude in the atmosphere.
- The bottom of the box is at a low altitude (the troposphere) where weather events occur.
- In this model, Lego bricks are used to represent storms.
- The sand or rice represents the atmosphere.
- Students are satellites at very high altitude (above the box)
- The skewer is a satellite sensor, capable of making measurements of the atmosphere.
Describe the scenario.
- In this location (around the Hawaiian Islands in the middle of the North Pacific) there have been reports of severe thunderstorms. A ship captain issued a distress call when caught in one of these storms. Your job is to identify the locations of the thunderstorms so that warnings can be issued for specific locations. Map the locations of the thunderstorms (Legos in this model) without removing the sand or rice.
Demonstrate to students how they will collect data using the skewer to note the depth.
- Explain that the map shows the geography of the location that is at the bottom of the box (the Hawaiian Islands and Pacific Ocean).
- Insert the skewer and make a mark where it hits the map (with a marker or masking tape). Explain that this is how deep the skewer will probe if it does not encounter a storm.
- Insert the skewer at an intersection in the grid. Mark that location on the other map, which will serve as a data collection map. If the skewer goes all the way to the bottom of the box, then there is no storm at that spot.
- On the data collection map, instruct students to use one color of pencil for data points that show no storm and another color to indicate the presence of a storm (Lego) at the bottom of the box (atmosphere).
- For a quantitative exploration, have students use a ruler with the skewer to accurately measure the height of the object in order to create a 3-dimensional model. The height could be represented on the 2-dimensional drawing by color or shading.
- Ask students how many data points they think they’ll need to collect until they find the storms. Write all the numbers guessed on the board. Decide as a class how many data points to collect. (Alternatively, have each group collect a different amount of data and compare at the end.)
Students collect data, searching for the storms.
- Pass out materials to each group.
- Have students collect the number of data points that the class decided upon in Step 5 (above) and then shade an area of the map where they think the storms are located.
- Ask students if they feel that they have enough data to decide where to issue severe weather warnings. If not, have students decide how many data points to add. Have students use a different color of pencil to shade the area where they think the storms are once they have the additional data.
- Allow students to remove the map from the top of the box, dump the sand/rice out, and place the map below the box so that they can see where the Lego storms are located. Then have students compare with the data sheet and map they made.
Discuss:
- Ask students if they felt that they had enough data points to identify the locations of the storms. With more data points, did they have a better idea of where the storms are located?
- Tell students that weather data is added to weather models to help improve forecasts. Ask students what they think would happen if we didn’t have as much weather data to add to the models. Explain that weather forecasts have become more accurate over the past several decades because we have a lot more weather data. And much of that data comes from satellites that take measurements of the atmosphere.
- Ask students to compare the storm locations they predicted with less data and with more data. (They should notice that having less weather data to collect took less time and was also less accurate. More weather data took more time and was more accurate.)
- Have students discuss how the plastic shoebox model is like the actual atmosphere and how it is different. Students should note that while the materials are different (i.e., sand instead of air), the process of collecting data about storms is similar. Students should also note that in this model storms do not change, which is unlike real weather.
Background
Weather data - such as temperature and humidity measurements, rainfall amounts, and atmospheric pressure - are collected in many ways. On land, weather stations outfitted with instruments collect measurements around the clock. Weather balloons carry instrument packages up through the atmosphere and dropsondes carry instruments down through the atmosphere. Data collected by the instruments is transmitted via radio signal back to the ground.For more information, check out the NOAA article Six Tools Our Meteorologists Use to Forecast Weather.
Over the ocean, satellites are an important source of weather data. Most of the weather data we have for areas that are not on land is from satellites. There are a variety of weather satellites and sensors that collect information about weather from afar. Some document cloud cover and air movement. Others deduce air temperature, pressure, or the amount of water vapor in air. Satellite data can be used to understand variations in the atmosphere with altitude at one location, or geographic variations in the atmosphere.
In recent decades, as the amount of satellite weather data has increased, the quality of weather reporting, warnings, and forecasts has increased as well. Weather data are added to weather models to make forecasts more accurate to help people prepare for weather events. This has led to more accurate weather forecasting. Five-day forecasts today are as accurate as three-day forecasts a decade ago, in large part due to higher quality weather data from satellites. For more information about how and why weather forecasts are becoming more accurate, see the NOAA article Building a Weather Ready Nation.
Extensions
Extension 1: To help students make connections between this simple model and actual weather events, have student groups find an image of weather radar via online search, which shows the shape of a storm. Each group will use Legos to make the shape of the storm within their box. Then student groups add rice or lentils to cover the storm, trade boxes with another group, and investigate the Lego storm using their skewer in the same method that they used during the main exploration.
Extension 2:The following news stories cover the April 14-15, 2018 storm in Hawaii described in the introduction to this activity. Have students read a news story about the storm’s impacts either before or after doing this activity.
- Heavy rains ease, rescue efforts improve after Hawaii storm, The Seattle Times, April 15, 2018
- A Hawaiian island got about 50 inches of rain in 24 hours. Scientists warn it's a sign of the future, LA Times, April 28, 2018