Tree Rings: Recorders of Climate Change
Students observe tree rings from tree cookie cross-sections (or from an image) and analyze simulated tree ring data to interpret paleoclimate conditions. We recommend completing Parts I-II as a sequence, and adding in Part III as desired.
Learning Goal
To recognize that evidence of climate conditions can be extrapolated by examining proxy data from sources such as the annual growth rings in trees.
Learning Objectives
- Students will identify seasonal and annual growth in tree ring samples.
- Students will understand that the thickness of a tree ring is affected by environmental conditions.
- Students will observe the direct correlation between climate and annual tree growth patterns.
- Students will learn how longer climate chronologies can be determined by combining tree ring samples from multiple trees.
Materials
- Trees: Recorders of Climate Change Slide Deck
- Tree cookies (thin cross sections of a small tree trunk)
- Video of collecting a tree core (optional)
- Magnifying glasses (optional)
- Clear plastic drinking straws (optional)
- Metric rulers (mm)
- Transparent tape
- Pencils
Preparation
Part I
- Prepare or purchase tree cookies. Do this well in advance!
- To prepare a class set of tree cookies: Use a saw to cut 0.5” to 1” thick cross sections through a tree trunk (a 4” to 6” diameter tree trunk is ideal). A local tree trimming service may be able to provide you with cuttings.
- Or, order tree cross sections from a classroom supply company (allow several weeks for delivery).
- Plan to have enough tree cookies for students to work in small groups of 2-3, or even to have enough for each student (if possible).
- If you are not able to obtain tree cookies, print copies of the Tree Ring Image for each small group of students to use instead.
- Print copies of the Trees: Recorders of Climate Change Student Activity Sheets for each student or group. Note: The final page (titled Trees As Recorders of Climate Change) isn't used until Part III: Step 10.
Part II
- Prepare the Four Simulated Tree Core Ring Samples from Pinetown for each group of students.
- Print and cut apart a set of four simulated tree ring cores (Cores 1-4) for each student group. Note: There are two sets of simulated tree cores on each page.
- Print on cardstock if you want to make sturdier cores.
- Optional: You can slide the paper strips into clear plastic straws to make the cores look more authentic.
Part III
- Print a copy of the Simulated Tree Cores from 1402-1960 for each group. Cut apart in advance to save time.
- Note: For younger students, or those who are less familiar with climate content, you may choose to skip Part III.
Directions
Introduction (10 min):
- Begin by sharing that an important part of understanding how the Earth’s climate is changing today is to study the climate of the past. Ask how we can know about the conditions on Earth from long ago, from even long before there are measurements of temperature or precipitation
- Look for student responses about any types of climate proxy evidence – evidence in rock layers including fossils, ice cores, sediment layers, and tree rings.
- If no one mentions tree rings, share that trees hold evidence of past climate within their wood.
- Share the puzzle question by reading this passage aloud:
The Arctic is a region of current concern because it is warming at a faster rate than other places on Earth. In Canada, paleoclimatologists, or scientists who study the climate from the past, are looking for clues about how the Arctic climate in the past was different from today, in hopes that it will help them better understand what a future, warmer, Arctic might be like. Currently, they have climate evidence from a forest in the Canadian Arctic dating back to about 900 years ago, yet the oldest living trees in this area are only about 700 years old. How can that be? - Allow students to share ideas, consider recording ideas on the board. If no one suggests that they can use dead trees to get climate evidence, let the unanswered question remain.
- Tell students that now we are going to learn how to use tree rings to decode clues about the past climate.
Part I: Trees Keep a Record of Climate (20 min):
-
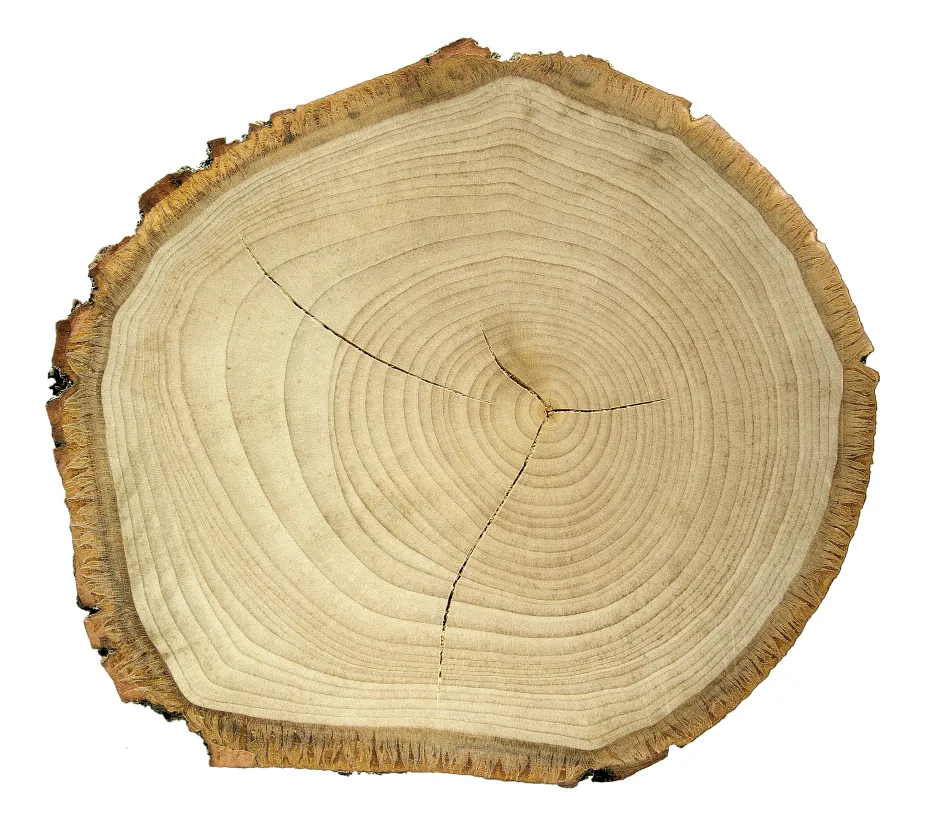
Pass out tree cookies or printed copies of the Tree Ring Image, rulers, and magnifying glasses (if using) to each student or group. Note: the tree ring image is also slide 1 of the Trees: Recorders of Climate Change Slide Deck, if you would like to project for reference as students work.
- Familiarize students with their tree cookie cross section. Explain that each tree cookie is a cross section of the tree trunk, and that trees produce rings as they grow each spring and summer.
- Lead students through discussion as they examine their tree cross sections using the following prompts:
- Ask students to describe the tree ring colors. Is there a pattern to the light and dark rings?
- Use slides 3-4 to explain that wood grown during the first part of the growing season is light in color and wood grown late in the growing season is darker. A light and a dark band together are the total growth for one year.
- Point out the pith, which is the dark ring at the very center of the tree. This is a special kind of plant tissue, and is not included when counting tree rings.
- Explain to students that the study of the ages of tree rings is called dendrochronology ("dendro-" is from the Greek for “tree,” and “chronology” is the study of a time sequence).
- Ask students how old their tree was when it was cut. (Students should count the light/dark couplets of rings to estimate age.)
- Ask students which rings they think are the youngest and which are the oldest? (There may be multiple hypotheses suggested. If so, discuss the likelihood of each hypothesis, leading students to understand that new growth is deposited around the outside each year, and thus, the outer ring is the youngest.)
- Point out that trees can be a record of time. If you know what year the tree was cut down, have each student count backward to find the ring that represents the year they were born. If using the paper version of tree cookies, have students label their birth year on the appropriate tree ring.
- Ask students to observe the thickness of the rings. They should notice that some rings are thicker than others. Have students use their rulers to measure the thickness of different rings. They can label ring thickness if using the paper version.
- Point out that trees can be a record of climate. Explain that tree ring thickness can vary from year to year depending on the growing conditions. Thick rings indicate a good growing season with plenty of water and sunlight, and narrow rings indicate a shorter or drier growing season. Looking at the thickness of tree rings over time can help us understand what the climate was like during the tree’s lifetime.
- Ask students to identify which year had the best growing season and which had the worst. Label this on the paper version.
- Tell students that scientists usually only use cross sections to study tree rings if the tree is dead (slicing the trunk to reveal the cross section would kill a live tree).
- Use slide 5 to explain tree coring. To study the rings of a living tree, scientists usually take samples of tree cores. When a tree is cored, a small cylinder of wood, about the size of a drinking straw, is pulled out. Coring does not harm the tree.
- Optional: Show the video of collecting a tree core.
- Before moving on to Part II, have students turn to a partner and take turns explaining why the following statement is true: Trees are recorders of time and climate.
- You can have students record their ideas on Part I of the student activity sheet. Listen for understanding about trees growing annular tree rings, and that varying thickness of tree rings is an indicator of the growing conditions.
Part II: Piecing Together Climate Clues From Multiple Trees (30 min)
- Pass out a set of Four Simulated Tree Cores to each student or group (Cores 1-4) and the Student Activity Sheet if you haven’t already done so. Note: Do not pass out the final page of the Student Activity Sheet until Part III: Step 10.
- Orient students to the simulated tree cores. The samples came from the following sources:
- Core 1: From a living tree in the Pinetown Forest in the fall of 2018
- Core 2: From a tree at the Pinetown Christmas Tree Farm a few years ago
- Core 3: From a log found near the main trail in Pinetown Forest
- Core 4: From a barn beam removed from Pinetown Hollow
- Tell students that they will count the annual growth rings in each sample to determine how many years each tree lived. Then, they will line up the core samples next to each other to build up a longer history of climate based on the combined tree ring patterns. Finally, they will analyze the combined climate record to see what they can determine about past conditions in Pinetown. They should record their findings in the data table on the student page.
- Review how to count tree rings using the simulated tree core samples. Remind students not to include the pith (core) or the bark when counting tree rings. In the simulated tree ring cores, each annual ring has a wide, white area that represents early wood, followed by a thin, black line that represents late wood.
- Give students time to match the tree rings and complete the table in their student sheet. The completed table should look like this:
| Core Sample | Age of Tree | Year Cut or Cored | Year Growth Began |
| 1 | 30 | 2018 | 1989 |
| 2 | 27 | 2015 | 1989 |
| 3 | 38 | 2013 | 1976 |
| 4 | 27 | 1995 | 1969 |
- If students need help, use the following tips to guide them:
- Counting the number of tree rings in each core sample will determine the age of the tree in years.
- Core sample 1 was taken from a tree in the Pinetown Forest in the fall of 2018, so its youngest ring grew in 2018. Count backward along the rings in core sample 1 to determine the year the tree started growing. This is recorded in the Year Growth Began column of the table.
- Next, students will align samples 1 and 2. Place core sample 1 and core sample 2 next to each other and slide the two samples back and forth until their tree ring patterns line up. These two trees lived at slightly different times, but most of their lives overlapped.
- Use the known dates for core sample 1 to determine the dates for sample 2. Matching ring patterns show that both trees began growing in 1989. Sample 2 was cut or cored 3 years earlier than sample 1, so its last ring is from 2015. Students can determine start and end dates for sample 2 by comparing with sample 1, then record these values in their tables.
- Use the same technique to align core sample 3 with sample 2. Place sample 3 next to sample 2 and align the ring patterns. As before, students can determine the year that sample 3 began growing and the year it was cut or cored and record those values in their tables.
- Repeat this process with core sample 4. Have students write the Year Cut or Cored and the Year Growth Began dates in their tables.
- Check the values students have entered into their tables. If you spot any errors, ask students to double-check their work by counting the rings again. The inner pith (core) and outer bark layers might cause confusion for some students. Remind students that those should not be counted as years.
The diagram below shows the appearance of the four simulated core samples when they are properly aligned.

- After students have completed matching tree core samples and filling out the table, hold a discussion to assess learning and make connections to climate conditions.
- Ask students to point to the tree ring (or rings, if they appear on more than one sample) that matches the year they were born.
- Ask students if the weather in Pinetown the year they were born was good for tree growth (wide ring) or not very good (narrow ring).
- Tell students that poor tree growth can be caused by different factors, including cold temperatures and drought (dry conditions where there is less precipitation than normal for an extended period of time). For the trees around Pinetown, the poor tree growth was mainly caused by drought. Ask students to identify years that were probably drought years, which correspond to narrow tree rings.
- Drought years include: 1969-1971, 1975-1979, 1983-1986, 1992-1995, 2003-2005, and 2011-2013
- Ask students whether Pinetown had more years of drought or plentiful rainfall. They will need to count the total number of thin rings (drought years) across all of the samples and compare that with a count of wide rings (rainy years). The cutoff for what constitutes a sufficiently narrow ring to indicate drought, and likewise sufficiently wide rings to indicate rainy years, is subjective.
- This is a good discussion point to consider with your students. By our count, there are more narrow rings (roughly 20) than wide rings (closer to 10), so Pinetown has been experiencing more dry years than rainy ones over the past five decades.
- Your results will vary, depending on what you consider an "average" width ring and how much narrower or wider a ring must be to indicate drought and plentiful rain, respectively.
Part III: Trees As Recorders of Climate Change (30 min)
- Explain that in Part III we are going to use tree core samples from a larger area to study the climate over a much longer period of time. Pass out the Simulated Tree Cores from 1402-1960.
- Explain that the simulated tree ring samples are based on data from trees from high northern latitudes where the length of the growing season controls ring thickness. Since the length of the growing season is based on the temperature, thick rings will form when the climate is warmer, and thin rings will form when the climate is cooler. The simulated rings cover a period from 1402 to 1960.
- Direct students to Part III on the Student Activity Sheet and pass out a ruler to each student or group.
- Familiarize students with the directions before beginning. Students will make a hypothesis (or do this as a class), collect data, and make interpretations.
- Instruct students to develop a hypothesis about the climate over the total time interval: 1402-1960. Explain that the class will test the hypothesis by collecting data from tree rings. After studying the tree ring data, they will either accept the hypothesis or reject the hypothesis.
- Instruct students to measure the total thickness of the tree rings for each time interval in millimeters (model this procedure for students), recording the thickness in the appropriate place in the data table on the Student Activity Sheet.
- To get average ring thickness for each time interval, divide the measurement for each time interval by the number of years in each interval. Record this in the table.
- Have students answer the questions on the Student Activity Sheet and discuss answers as a group.
- Hold a discussion to summarize their findings. Ask students whether their hypothesis was supported by the tree ring evidence.
- Students should have noticed that the tree rings are thicker in the last two core samples (from about 1850 and beyond), which indicates that the climate is warmer.
- Pass out the final page of the Student Activity Sheet (titled Trees As Recorders of Climate Change) and introduce the Little Ice Age. Orient students to the graph of tree growth as another way to look at the data from trees. Have students record answers to the remaining questions.
- If possible, make connections to learnings students have had about the Little Ice Age in other classes (social studies or history).
- Discuss how tree ring growth patterns support evidence for a cooler climate during the Little Ice Age, with increased growth after that period ended. Explain that our understanding of how the climate changed following the Little Ice Age would be enhanced with more recent tree core data.
- Describe that paleoclimatologists use a variety of proxies to interpret past climate. These proxies indicate the relative temperature but are an indirect record of it. Ask students if they think that the tree rings are a source of direct or indirect evidence of past climates.
- Make connections to current climate warming and ask what tree ring patterns students might expect to see as a result.
Extensions
Arrange a field trip to collect core samples from local trees using a coring tool. Analyze the tree rings with your students.
Background
Dendrochronology: The study of the growth of tree rings.
Dendroclimatology: The study of the relationship between climate and tree growth with the objective of reconstructing past climates.
The growth layers of trees, called rings, preserve an interesting record of environmental conditions over the lifespan of the tree. They record evidence of environmental events such as floods, droughts, insect attacks, forest fires, lightning strikes, and even earthquakes. When there are many consecutive tree rings we can decode longer-term and more subtle changes in climate over time. Scientists can also combine tree ring patterns from many trees to create longer chronologies of climate history.
Introduction of the Puzzle Question
Researchers at the University of Toronto, Mississauga, are using tree rings to learn about the changing Arctic climate in Canada. They are observing a change in wood density related to the increasing Arctic temperatures. The puzzle question, meant to help engage students around the phenomena of trees as recorders of climate, was taken from an article about their work originally published in the University of Toronto Magazine:
https://magazine.utoronto.ca/research-ideas/science/solving-a-climate-puzzle-one-tree-ring-at-a-time/
Interpreting Tree Rings
Each year, new wood grows on the outside of the tree trunk, just under the bark. A year’s growth is called a tree ring. Each tree ring is made of a band of light-colored wood produced early in the growing season (spring and early summer) and a dark-colored band produced late in the season (late summer and early fall). A full year's growth includes both a light, early wood ring and a dark, late wood ring. Counting the rings of a tree will determine its age.
The pith is a special type of plant tissue found at the center of tree trunks. Scientists don't count the pith when counting tree rings. In the simulated tree ring cores used in this activity, each annual ring has a wide, white area that represents early wood, followed by a thin, black line that represents late wood. Finally, the last ring in each core is followed by bark. Students shouldn't count the bark when counting tree rings.
Sampling Trees
Scientists seldom cut down a tree to analyze its rings. Instead, core samples are extracted using a borer that’s screwed into the tree and pulled out, bringing with it a cylinder of wood about 4 millimeters in diameter. The hole in the tree is then sealed to prevent disease (see images of this process on the Tree Coring slide).
Tree Rings as Climate Proxies
Tree rings are an example of climate proxy data, providing indirect evidence of past climates. Scientists can use tree ring patterns to reconstruct regional patterns of climatic change. The amount of tree growth depends upon various local environmental conditions.
- The length of the growing season is related to the climate, namely the temperature. At high latitudes, the cooler temperatures result in a shorter growing season. Trees grow thicker rings when the growing season is longer and thinner rings when the growing season is shorter.
- In environments where water is scarce, the amount of tree growth depends on the amount of rainfall more than temperature. If a year is very dry, the tree hardly grows at all. In years when there is plenty of water, the tree will grow more than in a dry year.
If you count the number of tree rings, you can accurately tell the age of the tree. If you measure the width or thickness of the tree rings for each year, you can tell whether growing conditions for trees in that region were good or poor.
Scientists can use tree ring patterns to learn about past droughts and other aspects of climate. If a region is suffering from drought and is very dry for several years, the trees in that region will grow slowly and have very narrow rings. If the rings are a consistent thickness throughout the tree, the climate likely did not vary over the lifespan of the tree.
Tree Ring Data in This Activity
Dendrochronologists combine the data from different trees to create a longer history than they could make from any single tree. For example, imagine two trees that each lived for 100 years in the same location. If tree A started growing in 1830 and died in 1930, and tree B started growing in 1910 and died in 2010, we could combine their tree ring data to build a history of climate from 1830 to 2010. This would allow us to create a history of climate spanning 180 years, far longer than the record from a single, 100-year-old tree.
In Part II of this activity, students align simulated tree ring core samples to build a longer climate chronology for the area around the fictional village of Pinetown.
Most actual tree ring studies are done in either cold or dry regions where trees are barely able to survive and grow very slowly. In places where trees grow slowly because of cold temperatures, such as subpolar latitudes and in mountains just below the tree line, different growth rates are most strongly associated with slight changes in temperature. In such locations, tree rings that form during warm years are much wider than the usual rings formed in typically cool years. Variations in moisture levels are not as important of a factor in tree growth rates in cool climates, so the tree ring records primarily record temperature data in those places.
On the other hand, the growth rate of trees in arid regions is more strongly influenced by slight changes in precipitation from year to year, while changes in temperature would have a lesser impact on the variations in tree ring widths. By looking at tree ring patterns in different environments, scientists can learn about both temperature and precipitation patterns in the past somewhat independently.
In practice, dendrochronologists combine patterns from many trees in a region and average those together to estimate the climate history in that region. Two trees that grow within a few meters of each other could still experience substantially different microclimates, influencing their growth rates and, thus, ring patterns. One tree might be shaded by other nearby trees or be in a slight depression that collects water when it rains. The soil might be richer or poorer in one area. Scientists collect data from many trees in a region to average out these microclimate-induced fluctuations.
As modeled in this activity, scientists also combine records from trees that lived at different times to build up longer climate chronologies. As long as the trees have some overlap in their lifespans, it may be possible to match up their ring patterns to produce an extended history. Especially in arid regions, it may take a VERY long time for the trunk of a dead tree to decompose. In some cases, dendrochronologists can extract samples from trees that have been dead for centuries, which they then align with patterns from old, but still living, trees. Wood can also be preserved in human construction and crafts, and samples from various wooden objects have been used to extend tree ring chronologies. Examples include beams from old buildings and wood from log cabins, planks and beams from old wooden ships, and even samples of wood from old wooden instruments such as violins. In some places, forests have been flooded when new lakes formed, or trees fell over into peat bogs, preserving the wood for many generations. Some climate chronologies created by combining tree ring records span many centuries of time.
The simulated tree rings used in the third part of this activity were developed based on the results of a study by Briffa et al. (2001) in which the ring patterns of 387 trees from northern latitudes were used to interpret temperature variations over more than 600 years. Since the thickness of the simulated tree rings is based on the results from many trees, it shows an average trend. Typically, climatologists require at least 30 years of data to establish understanding of climate. Understanding changes in climate requires even more data. Generally, dendroclimatologists use large databases of tree ring data to compare the records of many trees and interpret when, where, and how quickly climates have changed.
The Little Ice Age
The timeframe of the Part III tree cores includes most of the Little Ice Age (A.D. 1350–1850), a period of particularly harsh climatic conditions in the Northern Hemisphere and possibly other locations. A combination of decreased solar activity and numerous large volcanic eruptions cooled the Earth. Cooling caused glaciers to advance and stunted tree growth. Livestock died, harvests failed, and humans suffered from the increased frequency of famine and disease. The Little Ice Age illustrates changes to climate that occur when the Sun is less active and the cooling of Earth is exacerbated by volcanic eruptions. Many other examples of climate change due to natural forces exist, including the Year Without a Summer (1816), which followed the 1815 eruption of Mount Tambora in Indonesia.