Exploring Atmospheric Dust and Climate with Augmented Reality
About the Activity
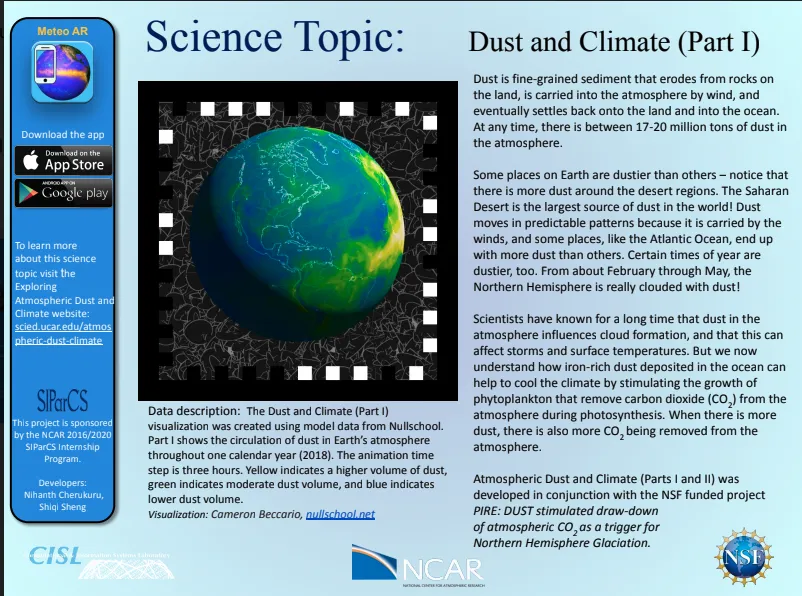
Through four connected visualizations, explore data that tell the story of atmospheric dust and climate. First, see the circulation of dust in the atmosphere over the course of one year. Next, see how chlorophyll concentration, which shows where phytoplankton are, increases when there is more dust entering the sea in the North Pacific. The third and fourth visualizations compare iron and nitrate concentrations in the different parts of the ocean. When put together, we see that in the areas where there is plenty of nitrate and when dustier times of year add extra iron to the ocean, the result is an increase in phytoplankton that draw down CO2 from the atmosphere.
Using the MeteoAR app and the printed Dust and Climate Part I and Part II science sheets, interact with these four visualizations in augmented reality. Use the links below to install the MeteoAR app on either an Apple or Android device. Print out the science sheets linked below and use your device to view them using the MeteoAR app.
Activity Resources
![]()

- Get the MeteoAR app for Apple or Android devices
- Visit the NCAR/CISL MeteoAR website for instructions on using MeteoAR
- Download and print the science sheets