Global annual mean surface temperature change
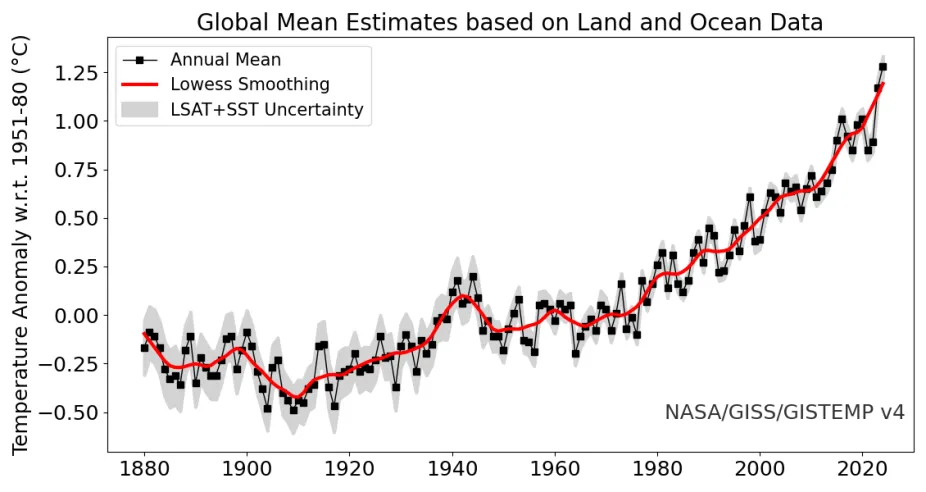
NASA GISS
Line plot of global mean land-ocean temperature index, 1880 to present, with the base period 1951-1980. The dotted black line is the annual mean and the solid red line is the five-year mean. [This is an update of Fig. 1A in Hansen et al. (2006).] Data for this graph come from https://data.giss.nasa.gov/gistemp/graphs_v4/