Climate Feedback Loops and Tipping Points
Feedback Loops Can Be Positive or Negative
The American Meteorological Society defines a feedback as a sequence of interactions determining the response of the system to an initial change. In the climate system, a feedback is a process that can work as part of a loop to either lessen or add to the effects of a change in one part of the system. When a process helps keep components of the system in balance, it sets up a negative, or balancing, feedback loop. When a change in one part of the system causes changes in the same direction in other parts of the Earth system, a positive, or reinforcing, feedback loop occurs.
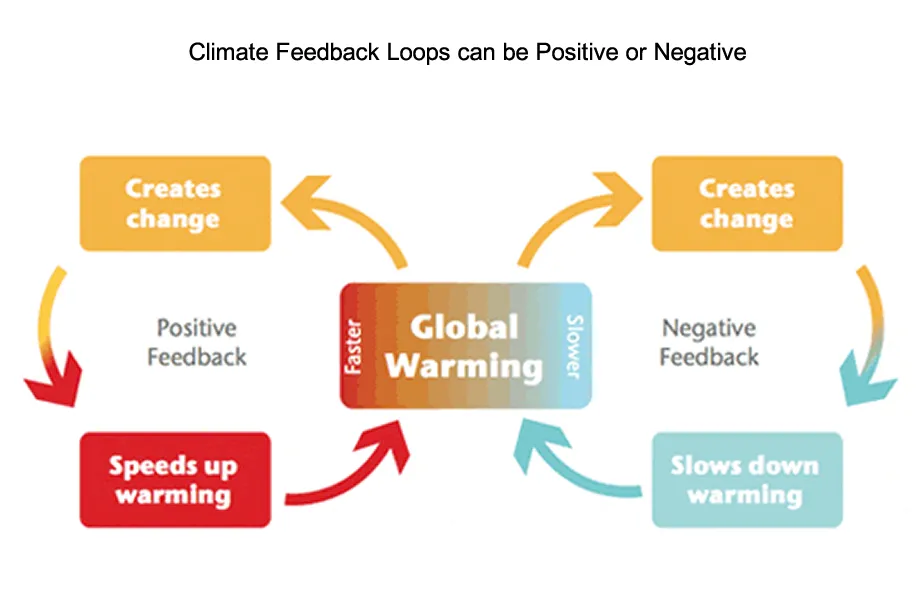
A climate feedback is an important part of the Earth system and can set up a loop that influences the type of change. Negative feedback loops help maintain a fairly constant level within the system. Positive feedback loops accelerate or amplify a change.
UK Met Office
An example of a negative, or balancing, feedback loop is the ocean’s ability to store heat, which helps keep temperatures in a livable range across the planet. Another negative, or balancing, feedback loop is the ability of plants and soil to absorb carbon dioxide, removing it from the atmosphere. When discussing feedback loops in our climate system, the word “negative” can actually be a good thing!
An example of a positive feedback loop is the relationship between global warming and increased amounts of water vapor in the atmosphere. A warmer planet causes more water to be evaporated from the surface, resulting in increased heat-storing water vapor in the atmosphere, which leads to more warming in an ongoing, continually amplified cycle. The positive feedback loop between global warming and melting ice sets up another amplifying effect and is already accelerating change within the climate system.
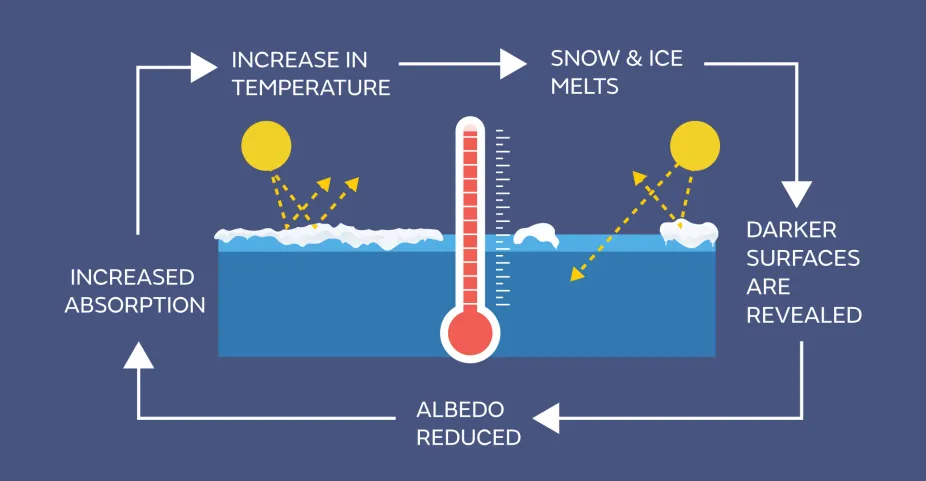
The climate system contains many positive feedback loops, including the interaction between warmer temperatures and ice and snow melt. As the planet warms, ice sheets and sea ice melt, revealing darker land or ocean surfaces that absorb more heat and become warmer, which causes more snow and ice to melt, and the cycle continues.
UK Met Office
Crossing Tipping Points Is Dangerous
Tipping points occur when a positive feedback loop crosses a threshold that leads to large changes, that often can't be turned around or reversed. Essentially, the positive feedback loop becomes so strong, or the changes begin happening so quickly, that the impacts are like a snowball accumulating mass and rolling so quickly downhill that it can’t be stopped.
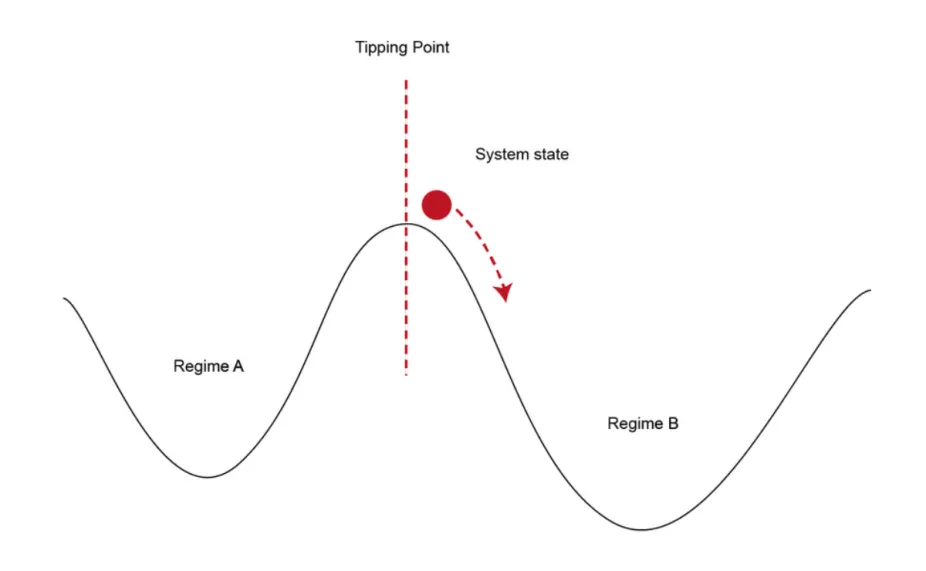
Tipping points within Earth’s climate system mark a threshold at which positive feedback loops can ‘tip’ an existing, predictable system into a profoundly different pattern.
Creative Commons Rauter et al.
Climate indicators that cross a tipping point mark a transition from an existing regime, or regular pattern, to a new state of the climate and a point of no return. Rising sea levels can be considered an example of this type of shift in conditions. As ice sheets melt, sea levels rise. If the melting of ice sheets crosses a tipping point to where the losses cannot be slowed down or reversed, an increased amount of sea level rise becomes unavoidable. Sea levels have already risen enough to have noticeable effects on many coastal areas. The rising seas represent a new “normal,” or new climate regime: no matter what we do, these changes cannot be easily reversed.
A new normal or new state of the climate might not sound like that much of a problem, but the observed 0.20-0.30 meter (8-12 inch) global average sea level rise is already having detrimental impacts. Many coastal cities are experiencing an increase in the number of days of nuisance tidal flooding each year. Nuisance flooding occurs during high tides (and is also sometimes known as high-tide flooding) and can inundate low-lying areas, close roads, and overwhelm storm drains. With the current and expected sea level rise, such flooding can be expected to continue (and worsen) in decades ahead.
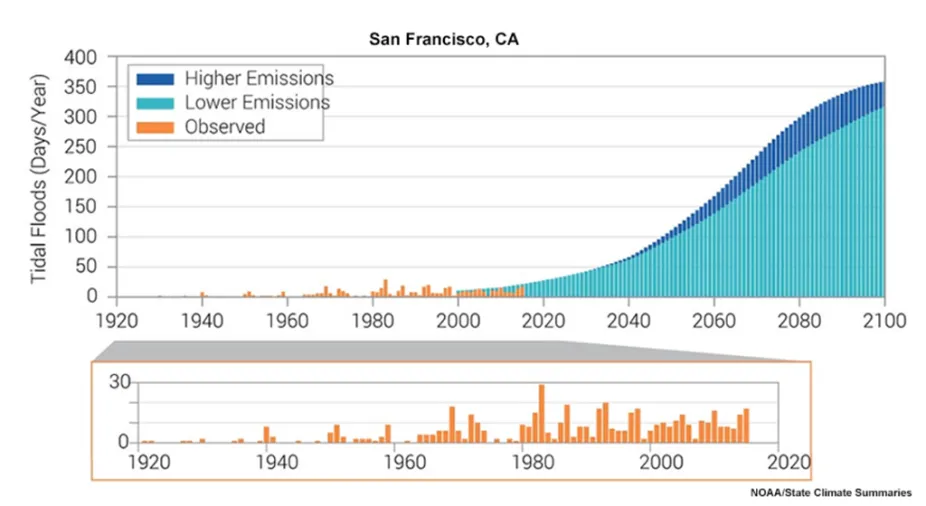
Nuisance tidal flooding has become more frequent in recent decades (shown in orange on the graph as the number of days experiencing flooding each year). Even under “lower emissions” scenarios, San Francisco could experience coastal flooding nearly every day by the end of this century.
NOAA/State Climate Summaries