Anatomy of a Storm’s Clouds
Students analyze cloud data from a storm that crossed the United States in late November 2019. They identify cloud types from photos of the sky in various locations to identify the zonation of clouds across a cold and warm front.
Students analyze cloud data from a storm that crossed the United States in late November 2019.
Learning Objectives
- Students will learn that different cloud types form in different parts of a mid-latitude cyclone.
- Students will relate cloud types to the dynamics of the atmosphere.
Materials
- Anatomy of a Storm's Clouds Slides
- Projector and computer to show the slides to the class
- A copy of the following for each student:
- Cloud identification tools: choose one of the following for students to use.
- UCAR Cloud Viewer (printable)
- GLOBE Cloud Identification Chart (printable)
- UCAR's Field Guide to Clouds app (download to mobile devices)
Preparation
Print the student pages and cloud charts and download the Field Guide to Clouds app on mobile devices.
Directions
Introduction
- Project the Anatomy of a Storm's Clouds Slides.
- Have students watch the video showing the movement of clouds and storms around the world (Slide 2). Have students focus their observations on the mid-latitudes (between about 30-60 degrees) and ask them to describe the pattern of clouds/storms in the mid-latitudes. (Students should notice that storms move from west to east in the mid-latitudes and that they are characterized by a comma-like shape.)
- Show students Slide 3, which describes weather map symbols for a mid-latitude cyclone's warm and cold front and the movement of warm and cold air. Explain that the storms that they saw in the video are called mid-latitude cyclones. These storms are elongated because they happen along fronts, where warm and cold air masses come together. (This content will probably be a review from middle school.) Provide the following definitions:
- A warm front is where a warm air mass gently rises over a cold air mass and slowly pushes it out of the way.
- A cold front happens where a cold air mass pushes into a warm air mass, and the warm air is pushed rapidly upward.
- Cold fronts typically move faster than warm fronts.
- Tell students that in this lesson, they will investigate what cloud types form around the cold front and warm fronts associated with a mid-latitude cyclone.
- Hand out cloud identification tools (see the materials list for options) and orient students to the cloud types. If the class has not done a cloud identification activity before this, students will need a more extensive orientation and discussion of the different cloud types before starting Part 1.
Part 1: Cloud identification and data analysis
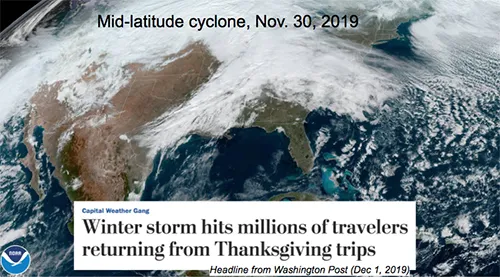
- Give students a briefing about the November 2019 storm that they will investigate as you show Slide 4, the GOES satellite image of the storm. Explain that on November 30, 2019, people were uploading their cloud observations using the GLOBE Observer Clouds app. Their cloud photos can be identified and help us understand where different cloud types form.
- Optional extension: Have students read this article about the snow storm and discuss how storms like this one affect people's lives. (The headline of this article is included on Slide 4 if you would like to mention it instead of reading the article.)
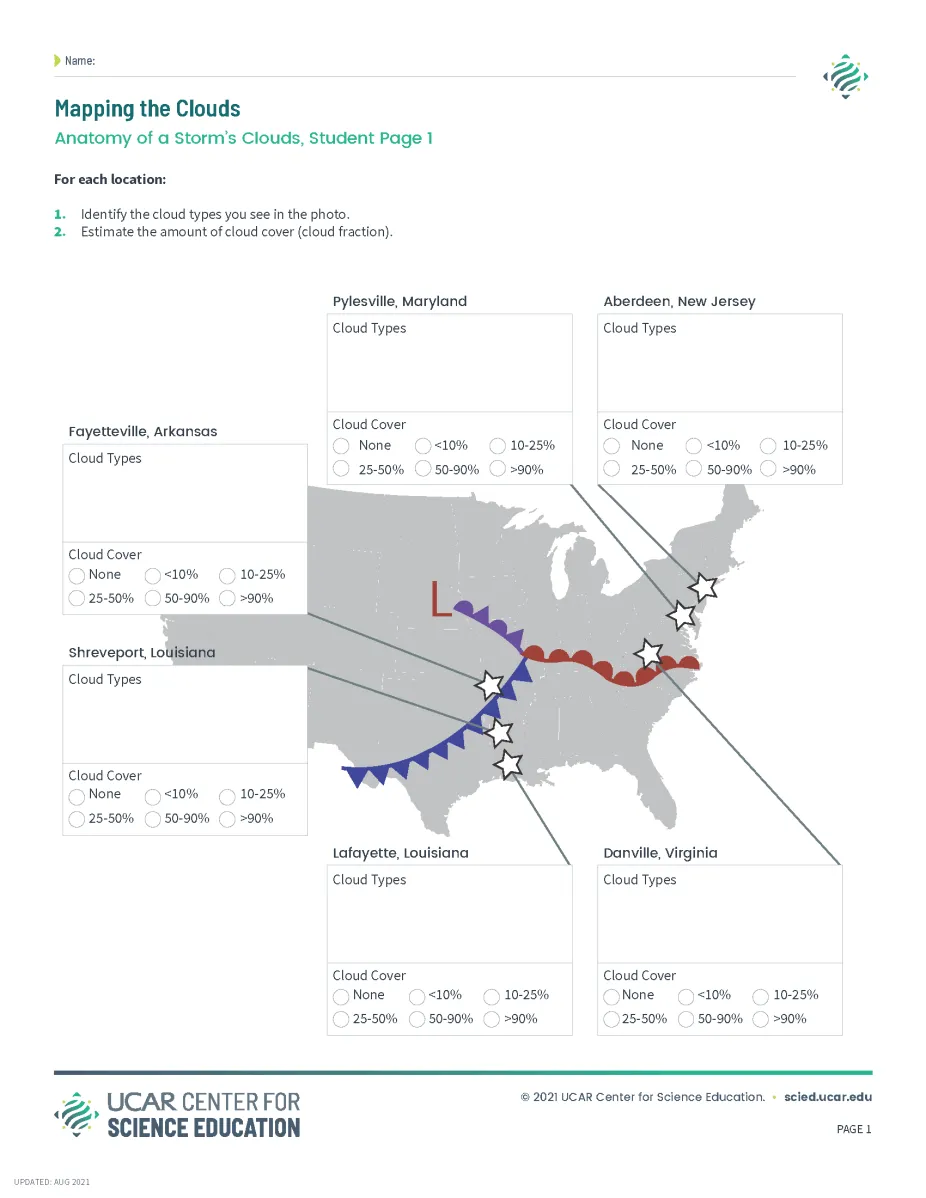
Mapping the Clouds Student Page, which students use to organize the data they collect from cloud photos in Part 1 of the activity
UCAR
- Hand out the Mapping the Clouds Student Page to each student, orient students to the locations on the map, and have students relate the cold and warm front symbols on their map to the GOES satellite image of the clouds on Slide 4.
- Show students Slide 5 and describe that these are the locations in North America where citizen scientists uploaded cloud observations to the GLOBE Observer app on November 30, 2019. Satellites like GOES document a storm's clouds from above. The citizen scientists documented what the clouds look like from below. Tell students that they are going to look at a few of those photographs and identify the cloud types to figure out the anatomy of this storm's clouds.
- Show project Slides 6-11one at a time, and have students make identifications following the directions on their Mapping the Clouds Student Page to identify the cloud types and the amount of cloud cover from the photographs. Students should add the information to the weather map on the student page.
- Note that to be thorough about cloud identification, one should observe clouds in all parts of the sky. However, for simplicity, students are identifying clouds in only one part of the sky in this activity.
- Identifying nimbostratus and cumulonimbus clouds requires knowing if precipitation is occurring (because, by definition, these clouds produce precipitation). Students may not know for sure whether a cloud is a cumulus or cumulonimbus by looking at a photograph. Tell students that it is raining, and they should be able to differentiate between cumulus and cumulonimbus. Remind students that they will not be able to see the towering structure of cumulonimbus clouds when looking at them from below.
- Review cloud types with students. While there can be some room for interpretation, students should have identified the following:
| Slide | Location | Cloud Types | Cloud Cover |
| 6 | Shreveport, LA | Cumulus/cumulonimbus | Overcast (>90%) |
| 7 | Lafayette, LA | Cumulus | Scattered (25-50%) |
| 8 | Fayetteville, AR | None | Few (<10%) |
| 9 | Aberdeen, NJ | Cirrus or cirrostratus | Scattered (25-50%) or Broken (50-90%) |
| 10 | Pylesville, MD | Altostratus | Overcast (>90%) |
| 11 | Danville, VA | Stratus/nimbostratus | Overcast (>90%) |
Part 2: Understanding cloud patterns
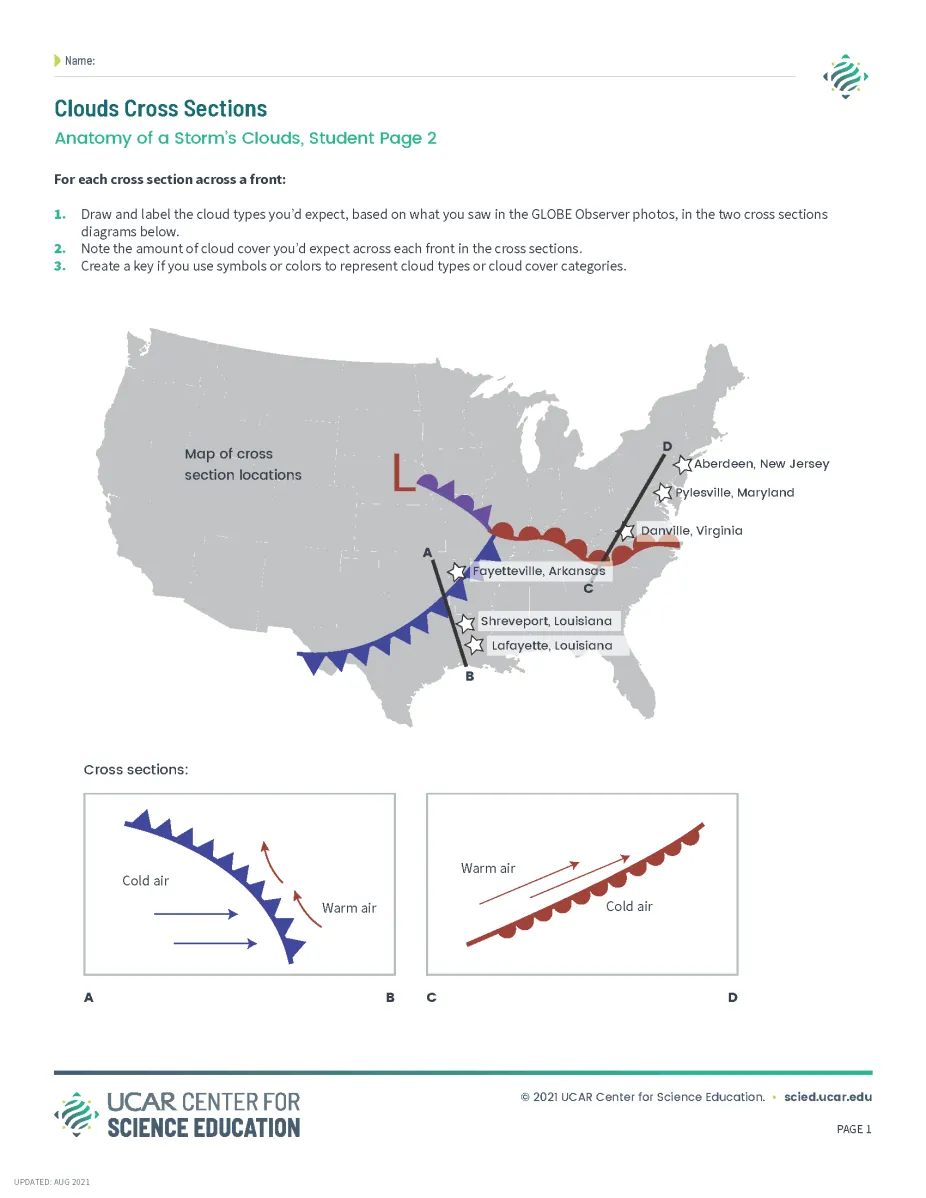
Clouds Cross Section Student Page, which students use in Part 2 of this activity to document the cloud types that they found across a warm and cold front
UCAR
- Provide students with the Clouds Cross Sections Student Page. Explain the cross-section templates to students (i.e., that each cross-section is showing what was happening in the atmosphere along a line. The lines are indicated on the map). Point out that the cross section between A and B goes from north to south while the cross section between C and D is from south to north. (This is so that both cross sections are oriented so that the direction of front movement is from left to right.)
- Instruct students to add the cloud types they identified along a cold front and warm front into the two cross-sections.
- As a class, compare and contrast clouds forming around a warm front and cold front.
- Consider what is similar about the two types of fronts that help clouds form. (Clouds form when air is moved upward.)
- Consider the differences between the two types of fronts that might cause different types of clouds to form. (The angle at which air is lifted is different.)
- Have students make a claim about why the cloud types and cloud cover are different along the two fronts. Students should base their claim on their cloud observations and the way air is moving along the fronts in their cross-section diagrams.
- For example, when air rises more directly (as at a cold front), the clouds that form are cumulus varieties. When air rises less directly (as at a warm front), the clouds that form are mostly stratus types.
- Assessment: Have students write a caption for each cross-section to explain the types of clouds that form along cold and warm fronts and why the clouds form.
Wrap up
- Have students share and discuss their conclusions.
- Ask students what is happening along a cold front to cause cumulus and cumulonimbus clouds to form (warm air is being pushed upward fast).
- Ask students what is happening along a warm front to cause stratus and altostratus clouds to form (warm air is being pushed upward, but more gradually).
Background
Mid-latitudes cyclones and weather fronts
A mid-latitude cyclone is a typical storm that occurs in the mid-latitudes, about 30-60 degrees north and south of the equator. It has cyclonic rotation (counterclockwise in the Northern Hemisphere and clockwise in the Southern Hemisphere) around an area of low pressure. The rotation brings cold and dry air masses, which are common at higher latitudes, in contact with warm and moist air masses, which are common at lower latitudes. When these air masses collide, weather fronts form. Several different types of weather fronts are associated with mid-latitude cyclones.
A cold front forms when a cold air mass pushes into a warmer air mass. Cold fronts can produce dramatic changes in the weather. In the Northern Hemisphere, cold fronts often are positioned on the south side of low-pressure systems where colder air from the west is advancing eastward. As a cold front moves into an area, the heavier (more dense) cold air behind the front pushes into the lighter (less dense) warm air ahead of the front, causing it to rise up into the troposphere. Lifted warm air ahead of the front often produces thunderstorms and/or short periods of intense rainfall. On weather maps, a cold front is represented by filled-in triangles along a solid blue line. The triangles are like arrowheads pointing in the direction that the front is moving.
A warm front forms when a warm air mass pushes into a cooler air mass. The warm air mass slides above the cool air mass, forming clouds and precipitation. In the Northern Hemisphere, warm fronts often form on the east side of low-pressure systems where warmer air from the south is pushed north. High clouds (like cirrus and cirrostratus) and middle clouds (like altostratus) can be seen far ahead of a warm front. As the front gets closer, the clouds become lower, and a long period of steady or light rain is likely until the front passes. On weather maps, a warm front is represented by filled-in semicircles along a solid red line. The semicircles indicate the direction that the front is moving.

Weather map showing the location of cold and warm fronts and direction of air movement around an area of low pressure
Credit: UCAR/L.S. Gardiner
Sometimes, to the north of the intersection of the cold and warm fronts in the Northern Hemisphere, there is an occluded front. At an occluded front, the cold air mass from behind the cold front meets the cool air that was ahead of the warm front, and warm air in between is lifted off the ground. Occluded fronts usually form near the area of lowest atmospheric pressure and often signify that the mid-latitude cyclone is nearing the end of its lifecycle. The weather ahead of an occluded front is similar to that ahead of a warm front (stratus-type clouds and light precipitation), whereas the weather at the occluded front itself is similar to a cold front (cumulus-type clouds and more intense precipitation). On a weather map, an occluded front looks like a purple line with alternating triangles and semicircles pointing in the direction that the front is moving.
Cloud types along fronts
Warm fronts produce clouds when a warm air mass slides above a cold air mass. In the photographs, students will see examples of stratiform clouds - stratus, nimbostratus, altostratus - as well as cirrus and possibly cirrostratus. In a typical wintertime warm front, high clouds (cirrus, cirrostratus) occur far ahead of the front, followed by middle clouds (altocumulus, altostratus), then by low clouds (stratus, nimbostratus) near the front. After the front passes, stratocumulus clouds can occur in the warm air mass. In the summertime, thunderstorms (cumulonimbus clouds) can also occur with warm fronts, if the rising warm air is unstable enough.
In comparison, cold fronts - where heavy, cold air pushes lighter warm air upward - are more commonly associated with cumuliform clouds (such as cumulus and cumulonimbus clouds). After the front passes, the cold air mass will be characterized by stratocumulus clouds or clear skies. Some cold fronts, particularly those that move westward from the Atlantic Ocean (which are called “back door” cold fronts because they move in the opposite direction from most cold fronts), can produce nimbostratus and stratus clouds.