Changing Ecosystems
![]() This is Part 3 of Lesson 3 of Project Resilience curriculum.
This is Part 3 of Lesson 3 of Project Resilience curriculum.
Students learn about the life cycle of brown shrimp and analyze data to investigate how fisheries are impacted due to environmental change.
Learning Objectives
- Students will discover that the life cycle of the brown shrimp depends on multiple environments, each with unique water characteristics.
- Students will use data to make connections between changing wetlands ecosystems and declining brown shrimp populations.
Materials
- Project Resilience Slide Deck (slides 44-48)
- Projector & Computer
- Expert Group 1: Brown Shrimp Student Investigation Sheet(PDF)
- Expert Group 2: Brown Shrimp Student Investigation Sheet(PDF)
- Expert Group 3: Brown Shrimp Student Investigation Sheet(PDF)
- Expert Group 4: Brown Shrimp Student Investigation Sheet(PDF)
- Expert Group 5: Brown Shrimp Student Investigation Sheet(PDF)
Preparation
- Determine student grouping in advance (students will need to be in groups of five for the jigsaw activity).
- Print copies of the Expert Groups 1-5: Brown Shrimp Student Investigation Sheets (unless students can access them digitally).
- Review the background information and data within the Brown Shrimp Student Investigation Sheets.
Directions
Introduce the case study on Brown Shrimp (5 min)
- Show quote about shrimp fisheries to illustrate how important shrimping is to the Louisiana economy (slide 45): “77% of the shrimp harvested in the U.S. come from the Gulf of Mexico, especially Texas and Louisiana. Total domestic shrimp harvest brings around $500 million per year to US economies.” (NOAA Fisheries, July 2019)
- Ask students if they are, or know anyone who is, associated with shrimping. Ask if anyone has ever been out shrimping before. Allow for some telling of personal stories to anchor the idea of fisheries as a part of Louisiana’s culture.
- Tell students that today’s goal is to see how the challenges facing coastal Louisiana are affecting local ecosystems, and how changes to local ecosystems in turn affects us. As an example, we will consider the case of brown shrimp.
- Introduce the investigation question for the day, perhaps write it on the board: How are brown shrimp impacted by the changing coastal environment? How does this affect the people of Louisiana?
- Tell students we will be exploring two different parts of the Brown Shrimp story today: the effects of floodwater management and the effects of dead zones.
- Show the labeled map of Lake Pontchartrain (slide 46) (pronounced Pon-cha-train). You may also use Google Earth to show the location of Lake Pontchartrain to orient students to the area if they are not familiar with where it is.
- Tell students that Lake Pontchartrain is the largest estuary system in coastal Louisiana. Point out that Lake Pontchartrain receives freshwater from several rivers but also opens to the Gulf of Mexico, which means that it contains brackish water.
- Show the map of Global Dead Zones (slide 47).
- Provide a general definition of Dead Zones as an area of ocean water that is devoid of living things. The map shows the location of Dead Zones and correlations to human population density, as well as the size of the Dead Zone areas, indicated by the size of the red circle. Students will likely make connections between increased water pollution where human populations are highest, thus leading to Dead Zones. Point out that Dead Zones are a global issue, not just a problem for Louisiana.
- Tell students that we will learn more about what dead zones are, and why Lake Pontchartrain is important, in our group investigations.
Jigsaw investigation of brown shrimp (25 minutes)
- Split students into “home” groups, each home group should have five students (if some groups need to have more than five students, “extra” experts for Group 3 is suggested). Tell students that each member of their group will investigate a different part of the Brown Shrimp story, using the jigsaw structure (from Lesson 1). Refresh students on the jigsaw structure as needed.
- Each person in the group will become an “expert” on their part of the story.
- There are more channels through the wetlands, some of the lakes are now open to the ocean, and there is less low-lying land, which is mostly wetland.
- Assign one student from each home group to join the following “expert” groups. Then have students work with their expert groups to investigate the information on their activity sheets and answer the questions.
- Expert Group 1: Give each student a copy of the Expert Group 1 activity sheet. They will read an article about the opening of the Bonnet Carre Spillway and how this has impacted the fishing industry.
- Expert Group 2: Give each student a copy of the Expert Group 2 activity sheet. They will use the readings to learn about the brown shrimp life cycle and habitat requirements.
- Expert Group 3: Give each student a copy of the Expert Group 3 activity sheet. They will read about ocean salinity and interpret graphs of salinity data from Lake Pontchartrain to piece together understandings about how changing conditions in the marsh ecosystems could affect brown shrimp populations.
- Expert Group 4: Give each student a copy of the Expert Group 4 activity sheet. They will read an article about dead zones and how they impact the fishing industry.
- Expert Group 5: Give each student a copy of the Expert Group 5 activity sheet. They will use the reading and dead zones map to learn what dead zones are and where they occur in the Gulf of Mexico.
Interpreting the Salinity Data:
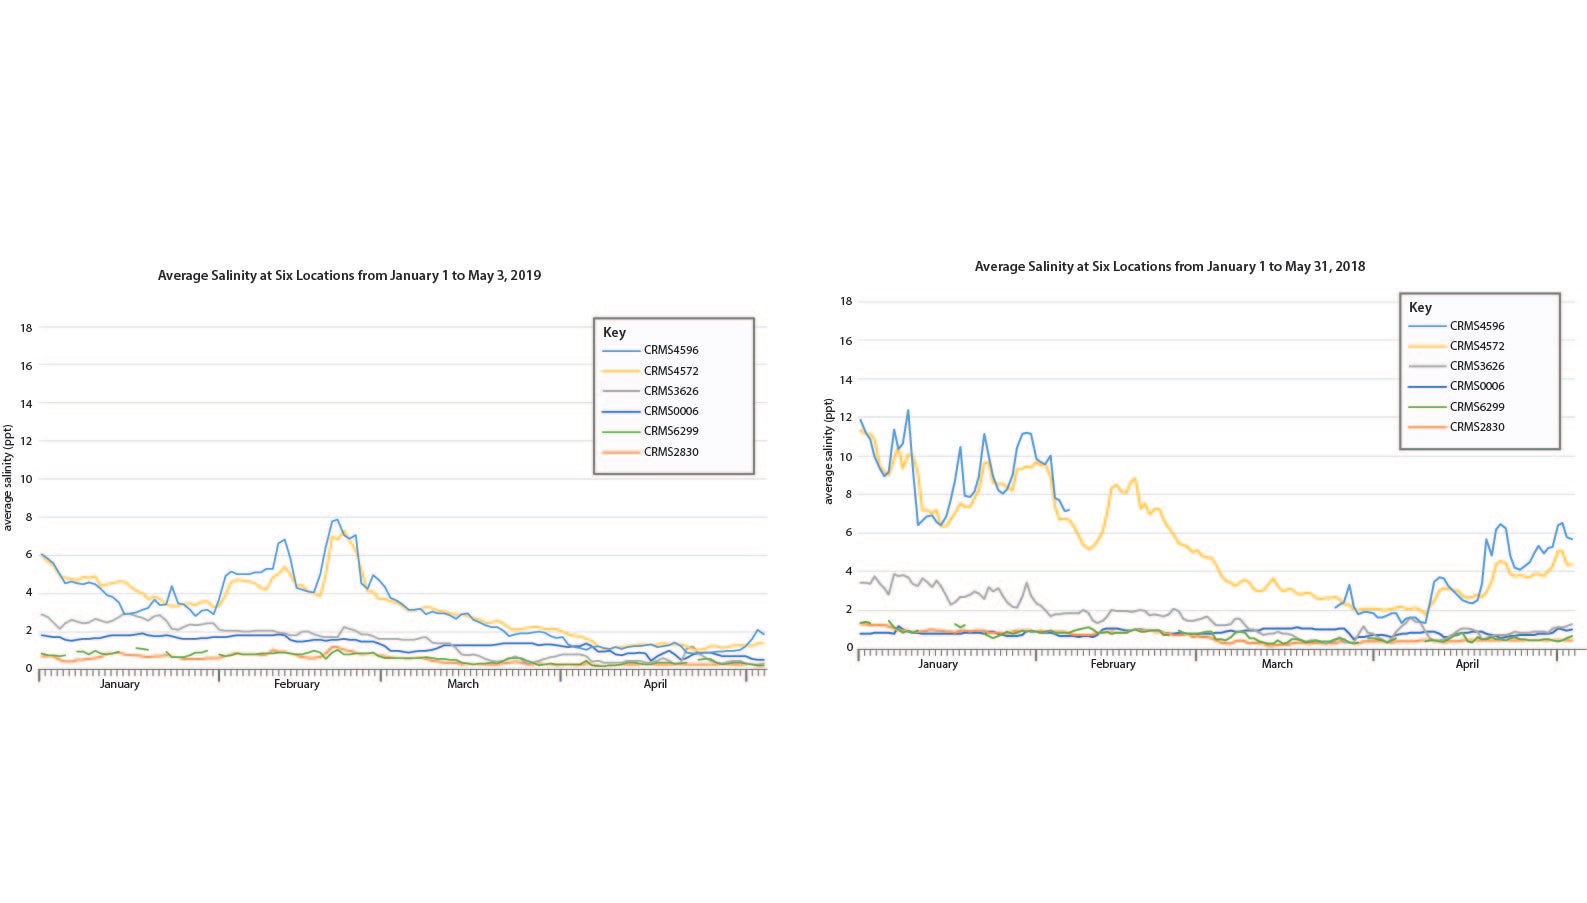
- Students may notice there are some disconnected trend lines in the graphs. These are the result of missing data from the monitoring sites, which could be for a variety of reasons.
- Though students are not examining an entire year of data, they should notice a natural cycle of decreasing salinity during the spring rainy season, with an increase in salinity heading into the warmer months due to increased evaporation. This natural cycle is apparent in the 2018 data, and a disruption of this cycle is observed in the 2019 data due to prolonged flooding and the opening of the Bonnet Carre Spillway.
- The sites with the highest overall salinities are located outside of the official boundaries of Lake Pontchartrain, which is to be expected. The drastic decrease in salinity of these two sites from 2018 to 2019 signals the potential impact of freshwater inundation on the ecosystem, which is supported by reports from the fishing industry about low Brown Shrimp landings for the 2019 season.
- Have students return to their home groups to share what they have learned.
- In home groups, students should be piecing information together to answer the investigation question for the day: How are brown shrimp impacted by the changing coastal environment? How does this affect the people of Louisiana?
Conclusions from the Brown Shrimp Investigation: (10 min)
- Bring the class back together for a share-out. Ask students to put together the pieces of the story that we now know. Sharings might include:
- The fisheries were able to catch significantly less in 2019, which puts financial stress on the industry.
- Much more water from the Mississippi is entering Lake Pontchartrain, which means that the salinity of Lake Pontchartrain decreased. There is also an increase in sediment entering the lake, along with an increase in fertilizers and pollutants.
- Shrimp use marshlands, like Lake Pontchartrain, and the gulf waters during different parts of their life cycle.
- Shrimp are sensitive to salinity levels; lower salinity levels in the marshlands where juvenile shrimp feed impacts the fishing industry.
- Dead zones are caused by an increase in nitrogen from fertilizers used on farmland along the Mississippi River from Montana all the way to the Gulf of Mexico.
- Eutrophication (which causes dead zones) intensifies in the summer due to warmer temperatures. Students might also connect that higher temperatures and lower oxygen in the water would affect salinity as well.
- The increase in dead zone size and frequency is making it harder for the fishing industry, and their harvests have been lower in recent years.
- Ensure that the investigation question for today has been adequately answered. Check for any remaining questions that students might have. Provide these additional clarifications, as needed:
- Reference the explorations with Google Earth from Lesson 2, where dead zones appeared on the map as fish skeletons to help students make connections to the previous learnings.
- Remind students that in Lesson 3 we learned that the brown shrimp catch is highest in the summer, which is when adult shrimp have moved back out into open water. This coincided with the appearance of Dead Zones.
- Students may think that shrimp catch will decrease because the adult shrimp have died due to lack of oxygen, but while this may in part be true, mostly shrimp are simply harder for fishermen to find. Because shrimp are mobile, they are able to leave the hypoxic zones.
- In addition, because environmental conditions are less desirable both in the marsh and in the ocean due to the extensive flooding of the Mississippi River in 2019, shrimp did not develop as quickly or grow as large, which are side effects that impact the fishing economy.
- Share that dead zone conditions occur in Lake Pontchartrain as well (slide 48). Opening the spillway caused a toxic algae bloom from the added fertilizer pollutants, just as it does in the ocean.
- Tell students that during the following class, we will shift our thinking towards the direction of solutions!
Revisit the Driving Question Board (10 min)
- Have students revisit the class Driving Question Board (DQB) that they created in Lesson 1. This is the final time we will visit the DQB with this driving question (we will add a new driving question for the next part of the curriculum). Ask the following questions:
- Are there any questions that we can now answer?
- Do we want to re-arrange any of the questions? Are there any connections between topics that we should show on the DQB?
- Would anyone like to add any additional questions?
Assign Journal Prompt #8
- Prompt #8: Step inside the perspective of someone who is connected to the challenges brought by changing ecosystems in coastal Louisiana. Imagine yourself as this person, and list your responses to the questions below from that perspective:
- What would this person see or notice about their ecosystem?
- What challenges might this person face?
- What might be important to this person?
- What might this person wonder about?
Background
Brown Shrimp life history
- Louisiana’s shrimp industry is based around the brown shrimp and white shrimp.
- Post-larvae the shrimp move to inshore estuaries (May-November). Juveniles move to nursery areas in estuaries and migrate out as they grow larger (August – September). Adults inhabit saltier offshore waters. Juvenile shrimp prefer marsh edge habitats, flooded grasses, & aquatic vegetation in upper estuaries.
- The life expectancy of brown shrimp is about 18 months. They reach harvestable sizes in 2–3 months under favorable environmental conditions.
- Louisiana is number one in commercial shrimp landings in the United States. Shrimp have been harvested commercially since the 1800s and are the most valuable and second-largest commercial fishery in Louisiana.
Factors impacting shrimp growth
- Salinity, water temperature, and dissolved oxygen can influence function, distribution, growth, survival, and movement of shrimp.
- Hydrological conditions within nursery (particularly in spring) play a large role in dictating next season’s potential harvest.
- They commonly tolerate lower salinity levels and exhibit a slower growth rate at higher salinities.
- Shrimp population size relates to river discharge and its effect on estuarine salinities.
- Extremes in salinity have been shown to reduce the growth rates of juvenile shrimp.
Factors affecting shrimp abundance
- Marsh habitat loss may affect shrimp yield because the yield of an estuary is directly related to marsh acreage.
- Low dissolved oxygen (hypoxia) areas have less shrimp. The appearance of Dead Zone corresponds with peak shrimp fishing and may impact shrimp harvests (shrimp avoid low oxygen areas).
Coastwide Reference Monitoring System (CRMS)
The CRMS design includes a suite of sites encompassing a range of ecological conditions of swamp habitats and fresh, intermediate, brackish, and salt marshes. Approximately 390 sites are monitored using standardized data collection techniques and fixed sampling schedules. The CRMS sites are located within nine coastal basins and four CWPPRA regions, covering the entire Louisiana coast. Comparisons of changing conditions are not limited to project influences but are possible throughout the coastal zone because CRMS was designed as a reference network.
The reference network approach enables assessment of ecological conditions at multiple scales. Within a CRMS site, there are many CRMS stations or plots. At each site, data are collected at a broader 1 km2 and a finer 200 m2 scale (Figure 3). At the 1 km2 scale, high-resolution aerial photography is used to calculate the ratio of land to water to investigate land change trends through time. Within the 200 m2 area, data are collected in the field using standardized protocols and consistent sampling intervals. CRMS data include water level, salinity, sediment accretion, surface elevation change, composition and abundance of vegetation, the ratio of land to water, and soil characteristics. The ten vegetation stations are in a diagonal transect across the 200 m2 area. The rod surface and accretion stations are nested around a boardwalk. The hydrologic station is generally in a bayou or water body near the boardwalk.
Salinity
Excerpt below from the National Ocean Service Monitering Estuaries Tutorial
"Under laboratory conditions, pure water contains only oxygen and hydrogen atoms, but in the real world, many substances are often dissolved in water, like salt. Salinity is the concentration of salt in water, usually measured in parts per thousand (ppt). The salinity of seawater in the open ocean is remarkably constant at about 35 ppt. Salinity in an estuary varies according to one's location in the estuary, the daily tides, and the volume of fresh water flowing into the estuary.
"In estuaries, salinity levels are generally highest near the mouth of a river where the ocean water enters, and lowest upstream where fresh water flows in. Actual salinities vary throughout the tidal cycle, however. Salinity levels in estuaries typically decline in the spring when snowmelt and rain increase the freshwater flow from streams and groundwater. Salinity levels usually rise during the summer when higher temperatures increase levels of evaporation in the estuary.
"Estuarine organisms have different tolerances and responses to salinity changes. Many bottom-dwelling animals, like oysters and crabs, can tolerate some change in salinity, but salinities outside an acceptable range will negatively affect their growth and reproduction, and ultimately, their survival.
"Salinity also affects chemical conditions within the estuary, particularly levels of dissolved oxygen in the water. The amount of oxygen that can dissolve in water, or solubility, decreases as salinity increases. The solubility of oxygen in seawater is about 20 percent less than it is in fresh water at the same temperature."
The Gulf of Mexico Dead Zone
Excerpt below from an article by Elizabeth Carlislein The Louisiana Environment
"The Gulf of Mexico hypoxic zone is a seasonal phenomenon occurring in the northern Gulf of Mexico, from the mouth of the Mississippi River to beyond the Texas border. It is more commonly referred to as the Gulf of Mexico Dead Zone because oxygen levels within the zone are too low to support marine life. The Dead Zone was first recorded in the early 1970s. It originally occurred every two to three years, but now occurs annually. In the summer of 1999, the Dead Zone reached its peak, encompassing 7,728 square miles.
"Hypoxic conditions arise when dissolved oxygen levels in the water fall below two milligrams per liter of water, too low to sustain animal life in the bottom strata of the ocean. The Dead Zone forms each spring as the Mississippi and Atchafalaya Rivers empty into the Gulf, bringing nutrient-rich waters that form a layer of fresh water above the existing salt water. It lasts until late August or September when it is broken up by hurricanes or tropical storms. The nutrients provide favorable conditions for the excessive growth of algae that utilize the water’s oxygen supply for respiration and when decomposing.
"The Mississippi River Basin covers forty-one percent of the continental United States, contains forty-seven percent of the nation’s rural population, and fifty-two percent of U.S. farms. The waste from this entire area drains into the Gulf of Mexico through the Mississippi River. Included in this agricultural waste are phosphorus and nitrogen, the primary nutrient responsible for algal blooms in the Dead Zone. Nitrogen and phosphorus were first used in fertilizers in the United States in the 1930s. Concentrations of nitrate and phosphate in the lower Mississippi have increased proportionately to levels of fertilizer use by agriculture since the 1960s when fertilizer use increased by over two million metric tons per year. Overall, nitrogen input to the Gulf from the Mississippi River Basin has increased between two and seven times over the past century. In addition to agricultural waste, inadequately treated or untreated sewage and other urban pollution are also dumped into these waters. Nitrogen is normally a limiting factor, meaning its restricted quantities limit plant growth and reproduction. However, excessive amounts of nitrogen can lead to eutrophication, the takeover of nutrient-rich surface water by phytoplankton or other plants. If nutrient pollution is not greatly reduced, fish and shellfish may someday be permanently replaced by anaerobic bacteria."
Part 3 Extensions
- Effects of flooding- Claim-Pass Activity: Ask students to make a claim about which piece(s) of evidence they think most support the idea that the flooding of the Mississippi River and the extended opening of the Bonnet Carre Spillway are responsible for the predicted decline in brown shrimp landings in 2019.
- Each student writes down their claim and evidence on a piece of paper. (Note: Be sure that each student writes their name on their paper so they can get it back at the end of the activity.)
- Have students choose a partner and take turns explaining their claim to one another.
- Students trade papers and find a new partner, this time explaining the claim on the traded paper (instead of their claim) to their new partners.
- If time, trade papers again and repeat.
- Share out and record student ideas.
- Use the Interactive - Gulf Dead Zone Through the Years to see how the Dead Zone has changed over time. Students can do this independently on computers/tablets, or project it to use a whole class.
- Use the online CMRS Spatial Viewer to locate specific areas where conditions would be favorable for juvenile brown shrimp to live, or investigate other water qualities, such as temperature, depth, vegetation, etc.
- Navigate to the CRMS Spatial Viewer.
- Click on a yellow dot to see information about a specific site.
- Click on the “Water” tab to see data such as salinity, water depth, and temperature. Click on the “Veg” tab to see marsh classification data.
- Investigate several different CRMS sites to gain an understanding of how conditions vary from site to site.
- For an additional case study of freshwater diversion, refer to the Mid Barataria Sediment Diversion plan (now defunct due to rising costs) and the article about the effects of river diversions on fisheries from The Advocate to consider the benefits and challenges associated with diverting sediment into Barataria Bay.
- Use the CRMS Spatial Viewer to locate sites that would be affected by the Mid Barataria Sediment Diversion plan.
- What might be the impact on shrimping fisheries if the sediment diversion plan is enacted? What might be the impact on the greater community if the plan is NOT enacted?
References
Additional Articles related to the opening of the Bonnet Carre Spillway:
Dead Zone resources:

Credits
This activity was developed for Project Resilience, funded by the Gulf Research Program of the National Academies of Sciences, Engineering, and Medicine.