Hurricanes and Climate
Students investigate maps and data to learn where and when hurricanes form and how climate change may be affecting them.
Learning Objectives
- Students describe the regions where hurricanes happen.
- Students graph and interpret data to learn that different regions have different numbers of hurricanes.
- Students will be able to explain that hurricanes happen during the warmest times of year and in regions that have warm sea surface temperatures.
- Students will graph and interpret data about how hurricanes have changed over recent decades as climate has warmed.
Materials
English
Other materials:
- Colored pencils
- Ruler
Preparation
Copy activity sheets for students and prepare to project the maps for the class during the activity.
Directions
Elicit prior knowledge.
- Survey student knowledge about hurricanes through class discussion. If students need background about hurricanes, have them use Student Activity Sheet page 1 to organize knowledge and questions as they read the UCAR Hurricanes explainer article.
Where do hurricanes happen?
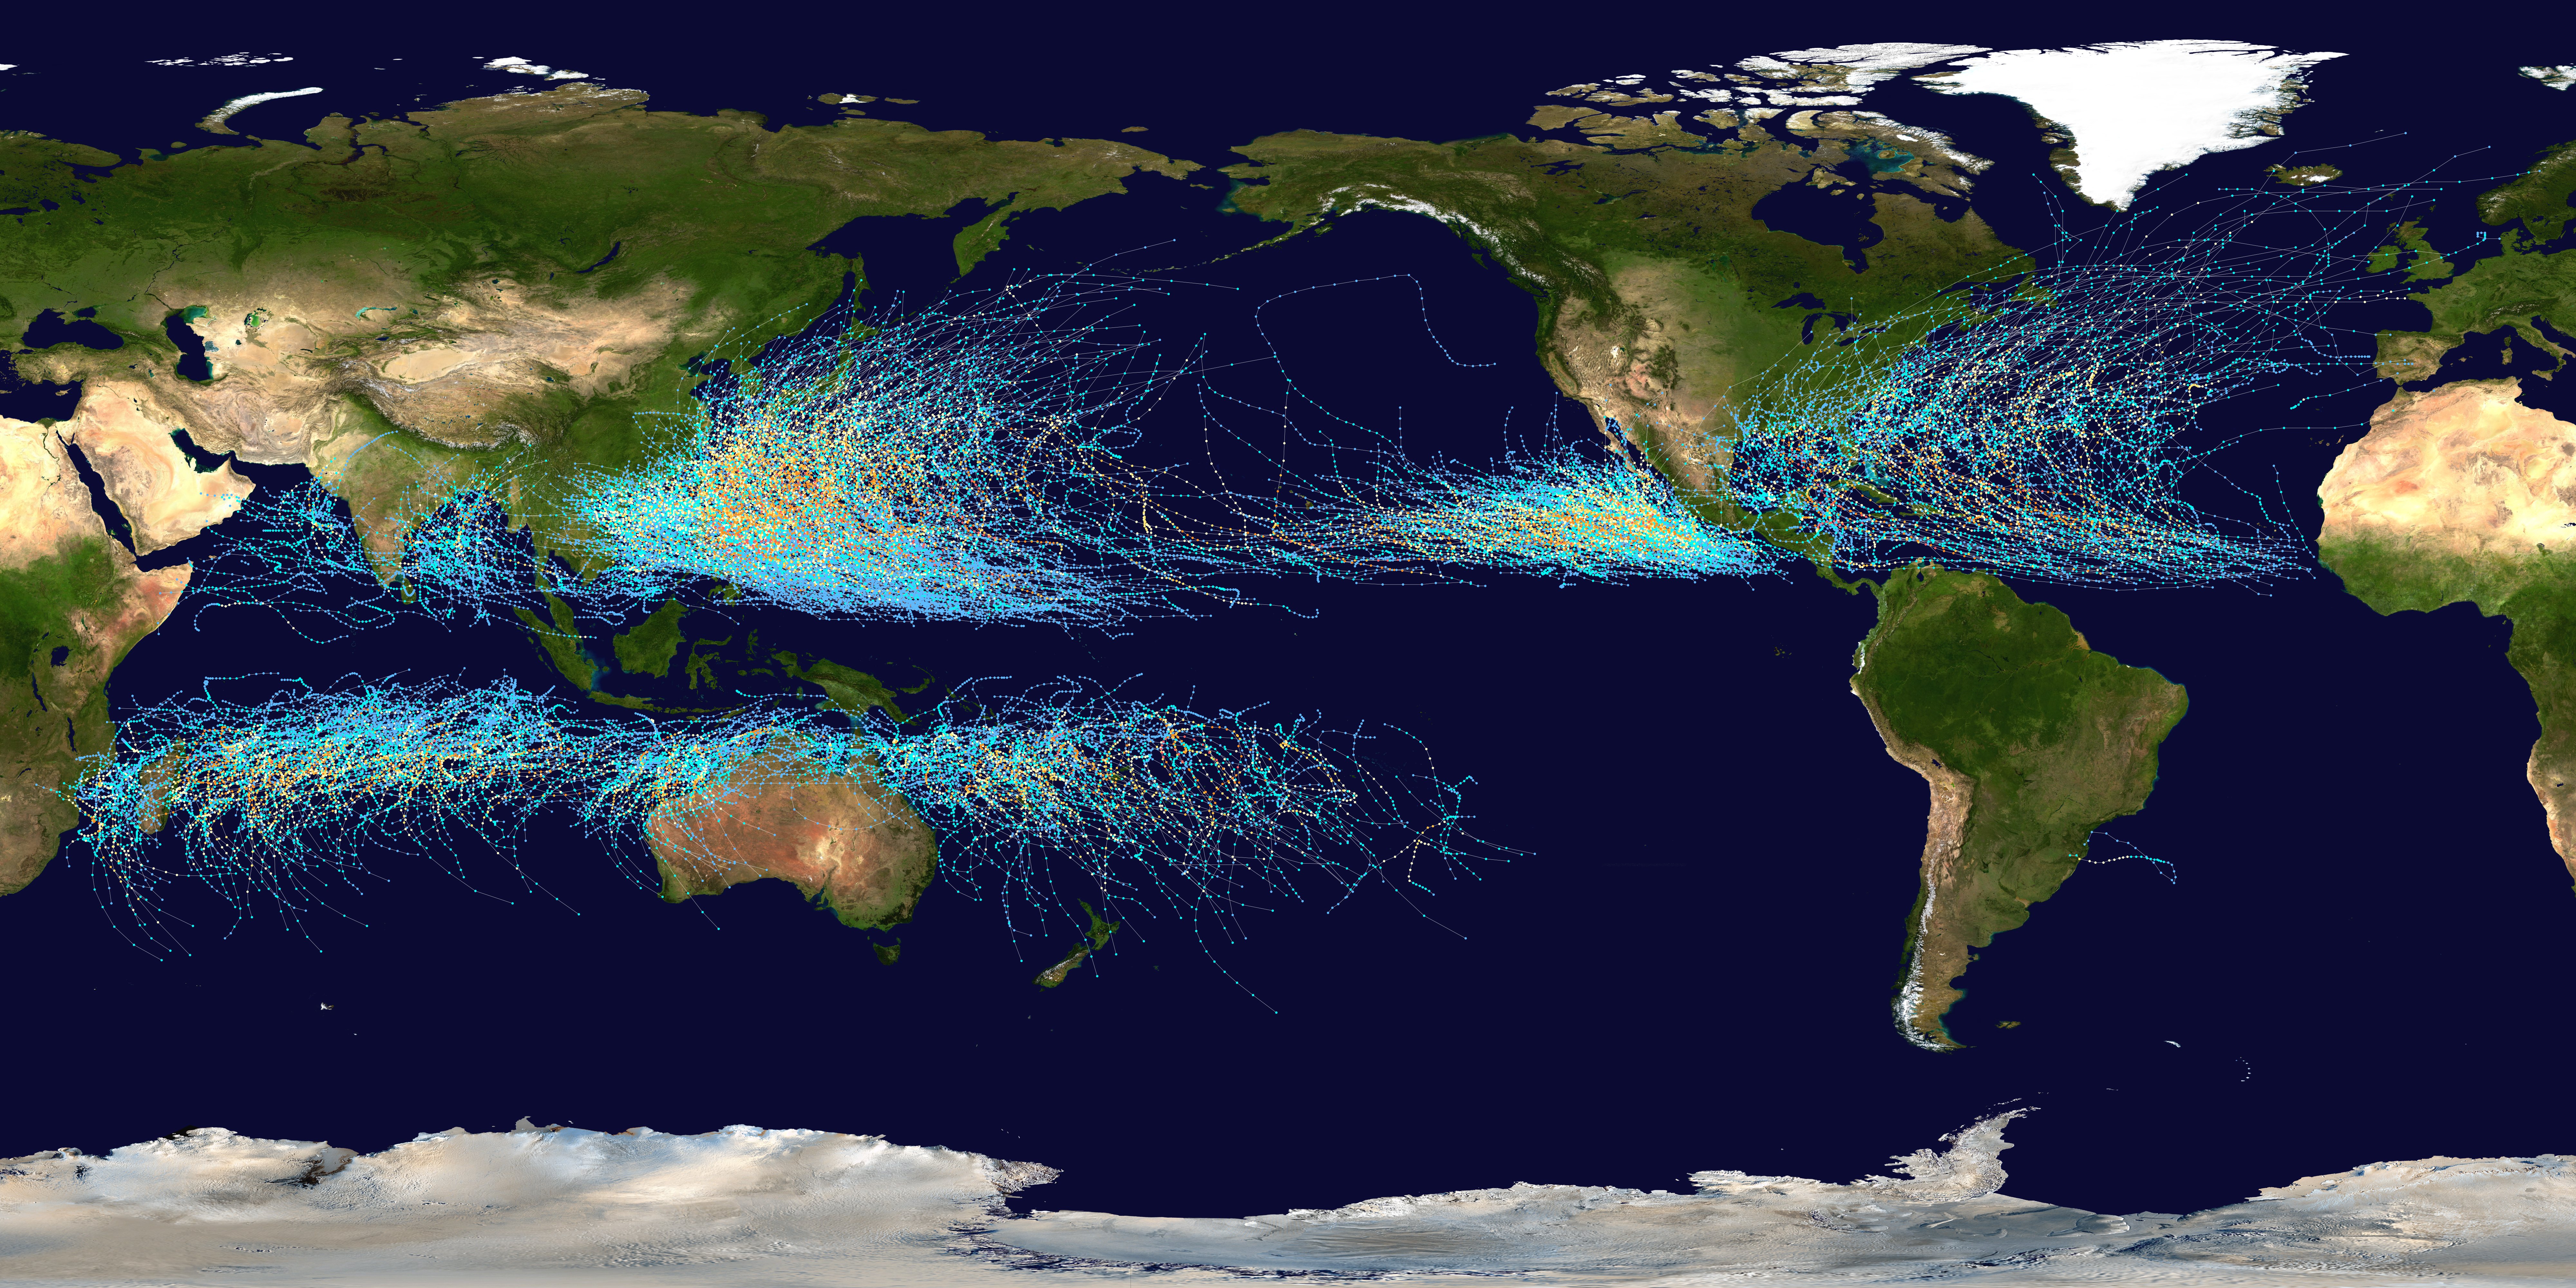
- Show the class the Map of Tropical Cyclones 1985-2005. Explain that the lines on the map show the paths of hurricanes and other tropical storms and there are six areas of the world where hurricanes occur. (Note that hurricanes are called tropical cyclones and typhoons in other parts of the world.)
- Referring to the map, ask students to color the approximate locations of these six regions on Student Activity Sheet page 2 using a different color for each region and then identifying the colors in the map key.
- As students notice where hurricanes do and do not occur, you may wish to share detail that connects with students' prior knowledge such as:
- Hurricanes are usually over the ocean, which provides warm, moist air that fuels the storms.
- The storms do not form at the equator where there is no rotating Coriolis force.
- They do not form at the poles because it’s too cold for tropical cyclones.
How many hurricanes happen?
- Looking at the Map of Tropical Cyclones 1985-2005, students will likely notice that there are more hurricane paths in some regions than others. As a class, develop a hypothesis about whether the same number of hurricanes happen in each region.
- Using the table on Student Activity Sheet page 3, ask students to create a bar graph (histogram) to explain how many hurricanes happen in each region. Ask students if their bar graph supports the idea that hurricanes are not equally distributed between regions.
When do hurricanes happen?
- Students investigate the seasonal timing of hurricanes on Student Activity Sheet page 4. Have students use the same colors they used for the map to indicate the hurricane season for each region on the timeline.
- The questions at the bottom of the Student Sheet are intended to point out that hurricanes happen at different times of year in the Southern and Northern Hemispheres and also that hurricanes happen during the warmest time of year.
Where’s the warm water?
- Project the Map of Sea Surface Temperatures. Tell students that this map shows the temperature of the water that is at the ocean surface as measured by satellites. Review the key with students.
- Have students compare the Map of Sea Surface Temperatures with the map they annotated on Student Activity Sheet page 2. Students should notice that hurricanes happen in areas where the ocean water is warm. Remind students that they had also figured out that hurricanes happen at the warmest time of year. Ask students to predict what might happen to hurricanes as our climate becomes warmer.
Is climate warming affecting hurricanes?
- Introduce the data tables on Student Activity Sheet page 6. The top table shows the total number of hurricanes that happened in each region during three different time periods. The bottom table shows the number of very strong hurricanes that happened during the same time periods.
- Instruct students to answer the questions on the right side of the page and consider the ideas they generated about how warmer climate could affect hurricanes.
Are hurricanes getting stronger?
Students represent the data from the lower table (strong hurricanes) in small bar graphs and then interpret the graphs to draw conclusions during the summary discussion. (See sample questions below.)
- Does this data indicate that there are more hurricanes now?
- Does this data show that there are more stronger storms?
- Why might climate warming cause changes in hurricanes?
- What other information would you like to have to know whether climate change is the cause?
Background
Hurricanes form in the tropics over the ocean where the sea surface is warm and so is the air. They go by different names in different places – like tropical cyclones and typhoons. Scientists use the Saffir-Simpson scale to describe the strength of hurricanes (Category 1-5). Hurricanes form in areas of low pressure over a large area of warm water. Air is drawn into the low pressure in a spiral pattern due to the Coriolis effect. Hurricanes draw energy from the warm water they move over.
Scientists have determined that the strength and length of storms are probably affected by climate change. There is evidence that the number of hurricanes during each season changes over time with a natural cycle and may not be directly affected by climate warming.
As climate warming causes the ocean surface to warm, the intensity of hurricanes will likely increase. Hurricanes take heat energy from the oceans and convert it into the energy of the storm. Thus, warmer oceans offer more heat energy to hurricanes, allowing them to become stronger storms with higher winds.Also, as climate warms hurricanes are able to transport more moisture, which can cause intense precipitation and devastating floods and damage, like those that occurred with Hurricane Harvey in the Houston, Texas area in 2017.
In the final part of this activity, students compare hurricane data from three time periods to explore whether there is a trend in the number of strong hurricanes (using a method similar to Webster et al., 2005). Students observe that there is evidence that storms are becoming stronger but also note that the trend isn't as clear in all regions. This is an area of active research and scientists are currently trying to learn more about the connection between warming and strong hurricanes.There is strong evidence that recent climate change caused by humans has been increasing the intensity of hurricanes.
- For more information, see Webster et al., 2005, Changes in Tropical Cyclone Number, Duration, and Intensity in a Warming Environment. Science 309, 1844-46.
- If you would like students to look at the Map of Tropical Cyclone paths (1985-2005) in more detail, download the Wikimedia high-resolution version.