Climate Variability Card Shuffle

Climate averages and extremes are based on probabilities, not certainties. This makes climate trends difficult to predict with complete accuracy and very difficult to measure, except by looking at long-term historical data. In this activity, students use a deck of cards to model climate variability and longer-term trends.
Learning Goals
- Students will understand that long-term climate averages are the result of annual climate variability.
- Students will learn that climate variability makes detecting climate change challenging.
Materials
- A deck of playing cards for each small group of students (or one deck of cards if you are doing this as a whole class activity)
- Graph paper
- Pencils
- Rulers
- Projector and screen
- Graph of yearly global average temperature
-

Directions
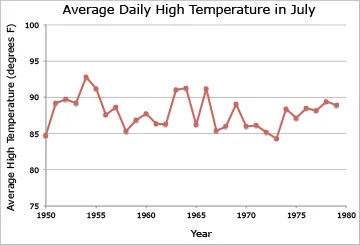
- Introduce students to the graph of annual global average temperature (in the background section of this activity).Discuss how the general trend of warmer temperatures is clear in recent years, but there is also variation from year to year.
- Tell students that in this activity they will use a deck of cards to model variability in temperature from year to year and find out what happens when the number of cards in the deck is changed. Tell students that in this model, each card in the deck is a year. Black cards designate cooler average global temperatures and red cards designate warmer average global temperatures. Jokers indicate global temperature that is the same as the long-term average.
- Provide students with the following instructions:
- Shuffle a deck of cards.
- Select 30 cards, one at a time. This will represent global average temperatures for 30 years. Look at the pattern.
- Make a graph of cooler and warmer years. Format the graph in the same way as the graph of yearly global average temperature. Time (years) should be on the x-axis and temperature (card value) should be on the y-axis with Jokers on the zero line, black card values below the zero line, and red card values above the zero line.
- Gather the cards. Remove four black cards from the deck. Recall that the black cards represent cooler than average years. By removing them, we are simulating the influence of global warming.
- Shuffle the deck and repeat steps b and c.
- Repeat this several more times, each time taking out four more black cards.
Observations & Questions
- Compare the graph of cooler and warmer years for the first 30-year period and the graph of cooler and warmer years for the second 30-year period. How are they similar and different?
- How many cards do you have to take out to make a noticeable change in a 30-year period?
- Relate the activity to actual weather data in the past 30 years.
Assessment
As formative assessment, circulate around the room as student groups do the activity and ask students to explain what they are finding and how it relates to climate.
A summative assessment should relate to understanding the difficulties involved in detecting directional changes in climate. Have students imagine that they're climatologists, asked by a citizens' group to explain why all summers and winters will not be warmer from now on as global climate warms. They may do this in writing or as an oral assessment.
You may want to ask students to present their graphs so they can share and discuss their results with other groups to look for trends, patterns, and differences among their graphs.
You can also ask students to discuss the simulation's limits – how the activity is NOT like the pattern of climate variation. (While each card pick is truly random, climate patterns can be longer-term and non-random. A sequence of cool or warm years may be caused by global-scale forces and occur regularly, even in the absence of long-term climate change.)
Background
For more detailed info about climate variability, check out our Climate Variability page.
Weather varies from one hour to the next, from day to day, and from year to year. We may experience a particularly cool summer one year, and an especially hot summer the next year. Scientists use the term "climate" to express the average weather over a series of years, usually spanning at least a thirty-year period. By taking a thirty-year average, scientists can determine the most likely range of weather conditions in a given place. The typical climate for a place includes factors like the expected temperature through the seasons, the usual amount of precipitation, and the typical wind speed and direction.
Climate also depends on location. Places near the North and South Poles have cooler climates than places near the equator. Locations high in the mountains are cooler than nearby places at lower elevations. Coastal locations usually experience smaller swings in temperature between day and night and between winter and summer than locations that are further inland.
To study global climate change, scientists consider the climate of the whole Earth by taking the average temperature throughout the seasons for all locations around the globe.
Over decades or centuries, the climate in a specific location or around the world can change as well. Both natural and human-influenced factors cause climate change. Because weather varies from year to year, it can be quite challenging to definitively detect changes in climate, even when fluctuations in weather are averaged over 30-year periods as is typically done when defining climate.
How can we be sure global climate is undergoing long-term change, not just a temporary fluctuation? The amount of temperature change and the length of time the temperature has been changing are useful guidelines for determining whether Earth's climate is changing. For example, if warming had occurred over only a few years, there wouldn't be much evidence of a long-term trend. However, global average temperatures have been warming for many decades, so we can be confident that there is a long-term warming trend underway. Also, if the average global temperature had warmed by only a small amount, such as a tenth of a degree, the evidence for a long-term warming trend would be weak. However, the average global temperature has become much warmer over the past century, which is why scientists are confident that climate is changing. The graph below shows warming of yearly global average temperatures since 1880, and the scale of the temperature change is large, which is why scientists have confidence that a significant, long-term change in climate is underway.
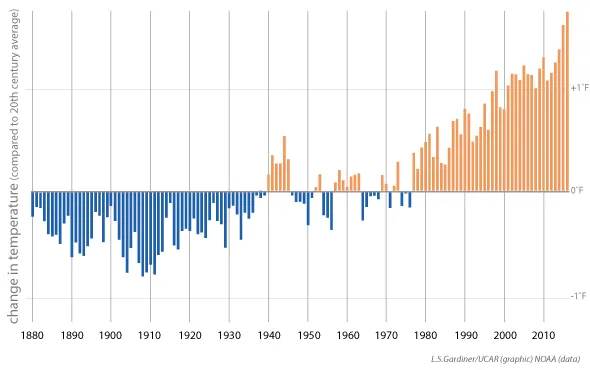
Global surface temperature anomaly from 1880 to 2017. Blue lines indicate temperatures that are cooler than the 1901-2000 average, orange lines indicate temperatures that are warmer than the 20th century average.
UCAR (graphic), NOAA (data)
Extension
You can make the activity more sophisticated by assigning a value (amount of temperature increase or decrease) to each card. For example, assign the following values to the heart or diamond (red) cards:
- Ace = 0.1° F temperature rise
- Two =0.2° F rise
- et cetera through 10
- Ten =1.0° Frise
- Jack =1.5° F rise
- Queen = 2.0° F rise
- King =2.5° F rise
Compute the average global temperature change for the 30-year period. Repeat this several times, taking out four black cards each time.
Modifications for Alternative Learners
This will be quite challenging to students who have difficulty with abstractions. While the activity may be clear, the meaning may be difficult to follow. For these students (and perhaps all students), a constant reminder and connection to the climate data is in order. For example, move around the room and ask students to explain what they've found so far in terms of climate, not cards.