Raise the Roof on Urban Heat
Students use a simple model to explore how roof colors can impact the temperature of an urban area.
Learning Goal
- Students will collect and interpret data to explore how the color of roofing material impacts the temperature of urban areas.
Materials for each group of 4 students:
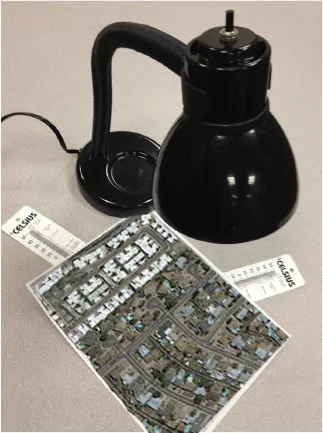
The set-up for this activity
UCAR
- 2 thermometers (or 1 IR thermometer)
- Printed Google Maps that contains light and dark-colored roofs.
- Tape
- Watch or stopwatch
- Paper and pencil for recording data
- Outdoor sunshine or a small desk lamp with a 100-watt incandescent bulb
- Student Sheet: Urban Albedos (optional - see link below)
- Reading: White Roofs May Successfully Cool Cities (High school)
- Reading: Urban Heat Islands (all)
Preparation
- Use Google Maps satellite view to locate an urban area with light-colored and dark-colored roofs. Print the images for use in this activity. (You can incorporate finding maps into the activity, or you can prepare the maps yourself. If possible, using maps from your community will add relevance for students.)
- Provide the links to readings or print copies for students.
- Print copies of the Urban Albedos Student Page.
Directions
- Ask students if they have ever noticed that wearing a black shirt on a warm sunny day will make you hotter. Ask them if they have noticed that they are hotter when standing on blacktop pavement/asphalt. Why is that the case? Discuss how light is absorbed and transformed into heat energy. Explain to students that the albedo of a surface is the amount of sunlight that is reflected. Explain that materials with a high albedo reflect most of the incoming sunlight. Materials with a low albedo absorb most sunlight, and urban areas are full of low albedo materials, which makes urban areas warmer than nearby rural areas.
- As homework, assign readings and ask students to survey the color of roofs in their neighborhoods or near school.
- Reading: Urban Heat Islands (middle and high school)
- Reading: White Roofs May Successfully Cool Cities (high school)
- Have each group of students look at the Google Map printout, identify roof colors, and make a hypothesis about which roofs they think would absorb the most solar energy and which would absorb the least.
- Instruct students to fix their thermometers to the back of the map using tape. One thermometer bulb should be under light roofs and the other under dark roofs. Remember to place the thermometers so that when you lay the map down on a table, the thermometers are right side up and can be read. (Alternatively, you can use an IR thermometer.)
- Place the light (not turned on) directly above the map, about a foot above.
- Ask students to decide who in their group is going to record the data, who is going to read the thermometers, and who is going to be the timekeeper.
- The two students read each thermometer before the light is turned on and give the numbers to the data collector. The temperature should be approximately the same at the start.
- Once they have the initial readings, groups should turn on their light and the timekeeper should begin timing. Students should take temperature readings every minute for five or more minutes. Advise students to read the thermometers without shading the light if possible.
- Have student groups create a PowerPoint slide of their results and present their findings to the class. Did all groups get the same result? If not, discuss what factors may have influenced the data.
- Ask students how this model is like, and unlike, the real world. This model shows relative differences based on the color of the surface but does not take into account the type of material. Have students brainstorm what else is in a city that might absorb or reflect sunlight.
- Use the Urban Albedos Student Page to quantify albedo of other urban materials.
Background
About Albedo
While Earth's temperature is dependent upon the composition and actions of the atmosphere, the amount of energy retained by Earth is strongly dependent on the albedo of Earth's surfaces.
Just as some clouds reflect sunlight into space, so do light-colored land surfaces. Scientists use the term albedo to define the percentage of sunlight reflected back by a surface. This surface albedo effect strongly influences the absorption of sunlight. Forests, grasslands, ocean surfaces, ice caps, deserts, and cities all absorb, reflect, and radiate solar energy differently. Sunlight falling on a white glacier surface strongly reflects back into space, resulting in minimal heating of the surface and the air immediately above. Sunlight falling on dark soil or rock is strongly absorbed and contributes to significant heating of the Earth's surface and the air above.
Understanding local, regional, and global albedo effects is critical to predicting global climate change. Light-colored ice and snow are very weakly absorptive, reflecting 80-90% of incoming solar energy. Dark-colored land surfaces, are strongly absorptive and contribute to warming, reflecting only 10-20% of the incoming sunlight. If global temperatures increase, snow and ice cover may shrink. The exposed darker surfaces underneath may absorb more sunlight, causing further warming. The magnitude of the effect is currently a matter of serious scientific study and debate.
About Urban Heat Islands
The air in urban areas can be 2 to 5°C (3.6 to 9°F) warmer than nearby rural areas. This is known as the urban heat island effect. It’s most noticeable when there is little wind. An urban heat island can increase the temperature and length of a heatwave. City heat can influence the weather - changing wind patterns, clouds, and precipitation.
What makes cities warmer? There are many factors that can influence the urban heat island effect. Changes to the land surface that are made in urban areas have a large impact on whether a heat island forms. For example, many cities have fewer trees than surrounding rural areas. Trees shade the ground, preventing the Sun’s radiation from being absorbed. Without trees, the ground surface heats up. Dark rooftops and pavement absorb more sunlight too. Automobiles, which make heat from their engines and exhaust, also contribute to the heat island effect. Fewer plants in urban settings mean that less evapotranspiration, a process that cools the air, occurs.
Some people have wondered whether the growth of cities has caused global warming because of their urban heat islands. There is very strong evidence that this is not the cause of climate change. According to the Intergovernmental Panel on Climate Change, global warming is very unlikely to be affected significantly by growing urban areas.
Today, many cities are making an effort to combat the urban heat island effect. White or reflective materials are being used for roofing and roads. Trees are being planted along city streets. Also, in many areas, green roofs - living plants on rooftops – are being installed.