Using ArcGIS with Hurricane Resilience

Using ArcGIS to Analyze Storm Story Data Geospatially
The data students collect through their storm story interviews (Hurricane Resilience: Lesson 3) can be integrated with ArcGIS to create interactive maps of the storm story data and add depth to the place-based components of the lesson. If your school currently has an account and you are familiar with ArcGIS, this is a great opportunity to engage in data analysis using these tools! If you are new to ArcGIS, visit Esri’s Teach with ArcGIS website, which includes tutorials and lessons to help you get started, or explore a quick introductory lesson using Get Started With Map Viewer tutorial. We recommend familiarizing yourself with the ArcGIS mapping tools using one of the tutorials before getting started on Lesson 3, if you plan to use ArcGIS with your students.
To create an ArcGIS account for your school, you will need to contact Esri to request a Free ArcGIS for Schools Bundle. Note: Anyone can create a free public account with Esri, but access to the advanced features needed to make the storm story map is not included with the public account.
Students who are already proficient using ArcGIS can use this as an activity to practice their data mapping skills. If your students do not have much experience using ArcGIS, you will want to make the map ahead of time and have them focus instead on analyzing the map during class.
Important: If you are creating an ArcGIS map of the storm story interview data, students will need to collect addresses during their interviews. ArcGIS Maps uses GIS coordinates to add locations to the map. Because the storm story interviews are coming mostly from the same area, location data that is more specific than city/town/state is needed to analyze geospatially. Have students record addresses on their Storm Stories Questionnaire or use the ArcGIS version of the Storm Stories Google Form if you plan to map the data. The Google form link will prompt you to make a copy of the form so that you can share it with your students.
Below is an example Hurricane Resilience Storm Stories Map made from student data collected during the curriculum pilot in Terrebonne Parish School District, Houma, LA (2019). Click on the arrows icon in the upper left corner to explore more features of the map.
Creating an ArcGIS map from student storm story data
- First, you will need to download your student storm story data from the Google form (or from Survey123 - see note below) so that you can add it to the ArcGIS map.
- Select the Responses tab from within the Hurricane Resilience Google form.
- Select the Excel icon from the upper right-hand corner to download the responses as an Excel spreadsheet.
- Before adding your data to an ArcGIS map, you will need to determine what the focus of your map will be and determine which data will work best for visualization on a map. Not all of the data collected in the spreadsheet will show up on the map in a meaningful way when visualized together. We suggest using the map to focus on analyzing the impacts of the storm:
- To do this, you will want to edit your spreadsheet so that only data from certain columns are included in the dataset you add to the map, such as: geolocating data (*required; address or latitude/longitude coordinates), Storm name, Was there flooding, Was there wind damage, and/or Were the roads closed.
- You may want to make a copy of your original data before you begin editing.
- We also suggest simplifying the data to include only ‘yes’ or ‘no’ responses (eliminating ‘don’t remember’ and ‘don’t know’ responses).
-
Navigate to the ArcGIS Online website and log in using your Esri credentials.

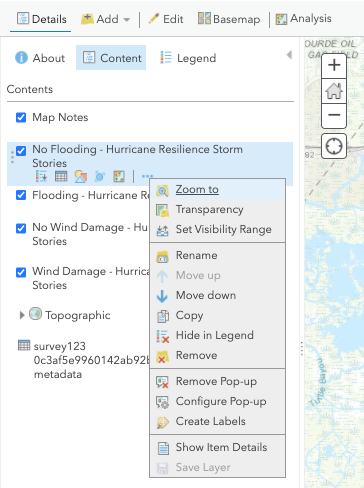
Customize your data layer by selecting from the menu of icons below each layer name.
- Add the survey data to a map in ArcGIS.
- Under the ‘Content’ tab, click ‘My Content.’
- Select ‘Add Item’ and navigate to your Storm Stories data file.
- Choose ‘Open in Map Viewer’ to add your data file to a map.
- You should see your data populate the map. You may need to add your data in batches so that it appears as separate layers within your map.
- In the example map from Terrebonne Parish, LA, data was added in four separate batches: flooding, no flooding, wind damage, and no wind damage. Adding the data in layers allows you to turn them on and off to compare the type of damage reported for different storms (each storm is represented by a different color on the map).
- View a tutorial video from Esri: Adding spreadsheet data to a map in ArcGIS Online.
- Use this resource for the steps needed to add layers from Excel.
- Center the map view on your area by typing the city/state into the search bar at the top right of the screen.
- Save your map by selecting ‘Save As’ from the ‘Save’ menu along the top. You will be prompted to enter a title and at least one tag for your map. Use the ‘Share’ tab to set viewing privileges. Making your map viewable by anyone (public) adds this map to the collective database and provides a link to share your map with your students. If you restrict the map to be viewable only by people within your school, they will need to be logged in to view your map.
-
You can rename the layers to something that will be easier for students to identify (“Flooding” or “Wind Damage,” for example) by clicking on the ‘Content’ tab in the panel to the left of the map, hovering over the layer, and then selecting the three dots (‘More Options’) to the right of the layer. In this drop-down menu, you can ‘Rename’ the layer. You can also ‘Configure pop-ups’ to get rid of any extra data fields you don’t want to show up.

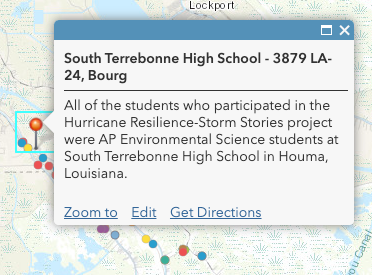
Add map points and text, images, or links to display within a pop-up.
- Also under the ‘Content’ tab, hover over the layer and select the three shapes icon (‘Change style’) to customize how the data appears on your map.
- From the ‘Edit’ tab, you can add map points (your school might be a good map point to add).
- You can create a description of your map from the ‘About’ tab. Adding a description provides an overview of what your map is displaying and where the data come from, which is particularly useful if you plan to share your map publicly. Select ‘More details’ to expand the ‘About’ view.
- Save your map again when it is complete.
Use Esri’s Survey123 to collect and analyze storm story data
The Hurricane Resilience curriculum provides a Google form that students can use to enter their storm story data. However, it is worth mentioning that Survey123 could also be used for this purpose. (Note: Survey123 should be included with your school license.) Survey123 works similarly to Google forms, in that students enter data from their storm story interviews into an online form, or in this case, a survey.
With Survey123 you can:
- Have students access your survey from any Internet-enabled device. (Google forms also allow for this.)
- Provide students a link to access your survey. Access the link from the ‘Collaborate’ tab. Be sure to select the appropriate “submitter” permissions.
- View analysis of the data as graphs and tables automatically generated by Survey123 from the ‘Analyze’ tab within your survey. These resources can allow you to extend your data analysis discussions beyond what is suggested in the Hurricane Resilience curriculum.
- View, filter, and export the data in multiple file formats from the ‘Data’ tab within your survey. The data can be exported as an Excel file, which can then be added to an ArcGIS map, and also used during Lesson 3: Accounts of a Storm (Day 4).
For more information, see the resources from Esri about creating surveys, including analyzing your survey results from within Survey123.
Analyzing storm story data using your ArcGIS map
- Project or share your Storm Stories ArcGIS map with students. Orient students to the map:
- Direct them to the panel on the left, which has options for viewing the Legend and the Content.
- Show students how to turn on and off each of the layers (Flooding or Wind Damage, for example) to see each storm effect on its own.
- Demonstrate how to zoom in on individual map points.
- Have students answer the following questions by analyzing storm story data with the map. If students are working together as a class, guide them through the questions. If students are working in pairs on computers, post the questions in the classroom.
- What do you notice? What patterns or trends can you see?
- Where are people most vulnerable to flooding?
- Where are people most vulnerable to hurricane winds?
- What questions do you have now? What do you want to know more about?
- Hold a wrap-up discussion to share learnings from exploring the map. Discuss limitations of the map for analysis (sample size is likely a good discussion point, as is the variety of hurricanes in the data). Ask students if looking at the storm story data in this way caused them to have new questions about hurricanes or hurricane damage. Make sure to document their findings on the board.