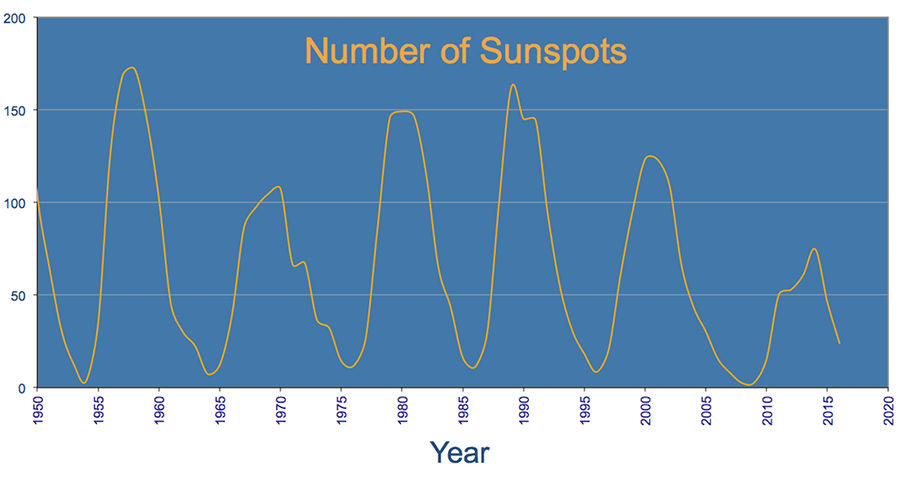
Graph of Sunspot Counts
UCAR, using data from NOAA's NGDC
This graph shows the number of sunspots counted each year for several decades. Notice how the sunspot count rises and falls in an 11-year cycle.
UCAR, using data from NOAA's NGDC
This graph shows the number of sunspots counted each year for several decades. Notice how the sunspot count rises and falls in an 11-year cycle.