Using Models to Predict Wildfire Risk
Wildfires, especially in the Western U.S., are getting stronger and harder to control. Researchers at NSF NCAR use models to help predict and understand wildfire behavior. This research helps government leaders, forest managers, and firefighters make decisions about managing and preventing wildfires.
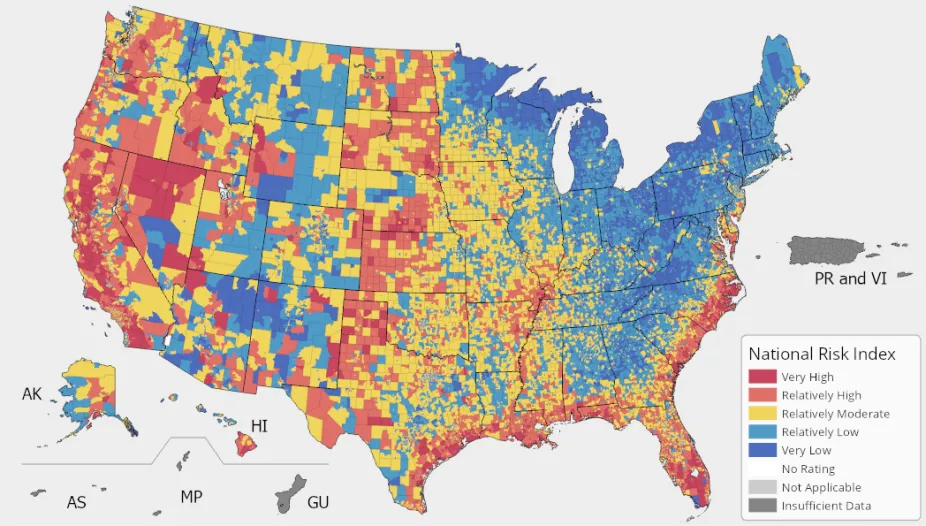
A comparative map showing the level of risk of wildfire in the United States.
Credit: FEMA, National Risk Index
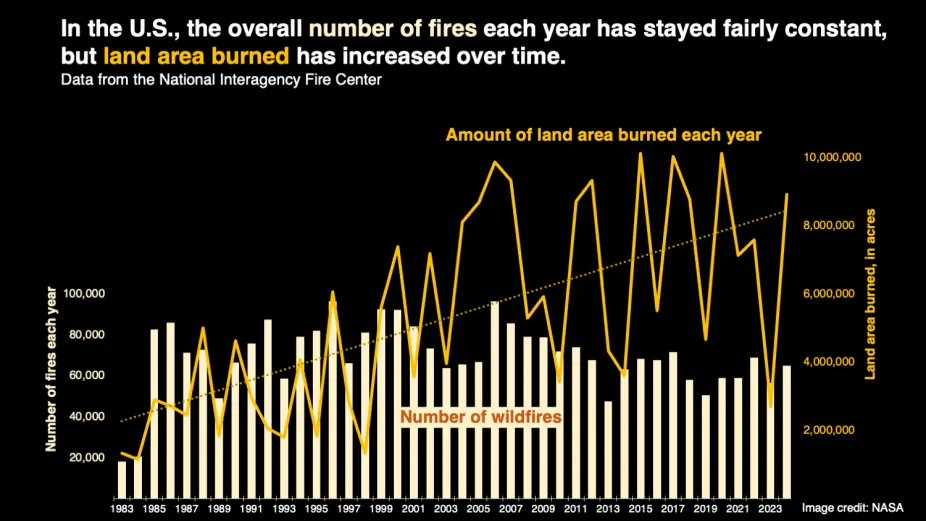
Number of wildfires and the amount of land burned in the U.S., 1983-2024. While the number of wildfires has been relatively constant, the amount of land area burned each year has increased.
Data Source: National Interagency Fire Center (NIFC); Image Credit: NASA
Modeling Wildfire Behavior
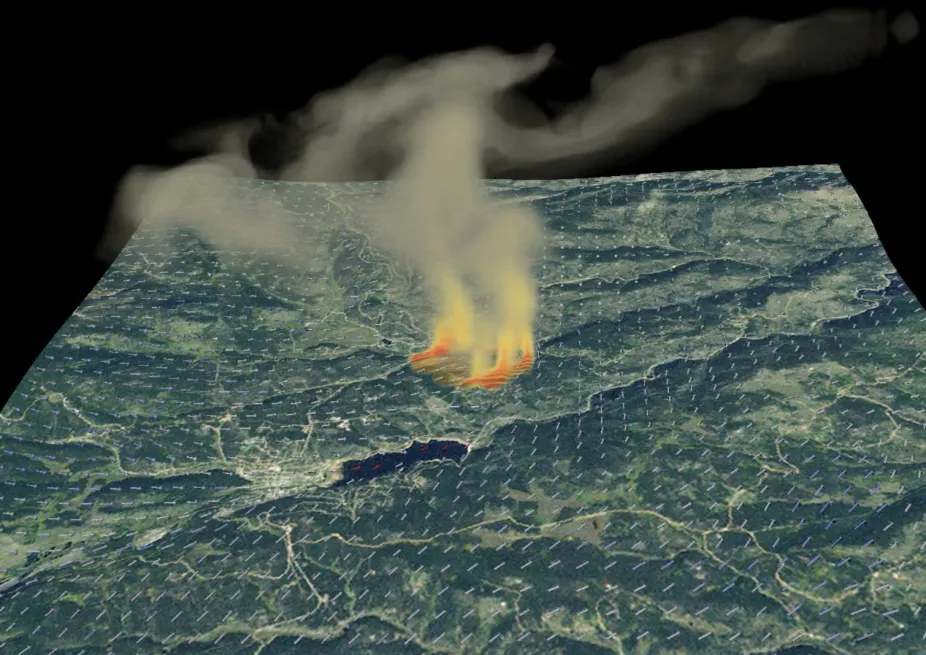
Wildland Fire Model (WRF-Fire) is a model researchers at NSF NCAR use to study wildfires in response to changes in environmental and weather conditions.
NSF NCAR
Computer models serve as an important tool in understanding wildfire behavior. Models allow researchers to use large sets of data to run different scenarios of a wildfire event. Because weather is an important component of wildfire prediction and management, models are often used to observe how heat waves, storms, and wind patterns can influence fire behavior.
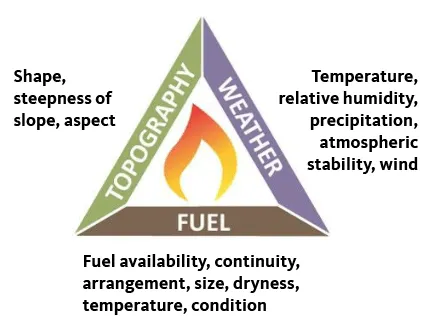
Fire Behavior Triangle: Fuel, Weather, and Topography as factors in determining fire behavior.
Credit: Oregon State University
Scientists also use conceptual models to help understand how wildfires spread. The Fire Behavior Triangle describes three things that affect how a wildfire spreads – fuel, weather, and topography. Researchers and wildfire professionals who need to assess fire behavior use this model to visualize how these three components interact with one another.
The fuel part of the triangle describes the type of burnable material present, how much there is, how dry it is, and the likelihood of it burning. Weather looks at wind, temperature, and humidity and how those can influence wildfire risk. Topography refers to the shape and slope of the land, which can affect how strong the fire gets, the overall rate of fire spread, and how accessible it is to get to a fire.
The East Troublesome Fire: A Case For Up-to-Date Fuel Data
One study from NSF NCAR focused on the use of computer models to predict changes in fuel data over time. In the fall of 2020, the East Troublesome Fire burned 193,812 acres in Colorado, making it the second largest wildfire in the state. The fire spread quickly, burning at one point more than 87,000 acres in a period of 24 hours.
Animated map showing the spread of the East Troublesome Wildfire in Grand County near Kremmling, CO, October 2020. Note the significant spread of the fire on October 22. The cause of the wildfire is still unknown.
Data source: National Wildfire Coordinating Group. Animated by: Kevin J. Beaty
Forest surveys of the area around Troublesome Creek from 2016, just four years before the fire, indicated that the trees were healthy and well spaced. Based on these data, the chance for fire was very low. But, by 2020, the forest had changed a lot. Warmer temperatures between 2016 and 2020 caused drought, which dried out the trees. Some trees died and fell to the ground due to disease, making more fuel for wildfire.
In 2020, the weather stayed hot and dry into the fall. Strong winds knocked down even more trees. The fuel for fires kept building up. The parameters for all three parts of the Fire Behavior Triangle were at play, making this a high-risk area. Once the fire began, it moved quickly uphill, a common trait of wildfires. The animation on the left shows how quickly the East Troublesome Fire spread in a matter of days, especially on October 22 when winds had increased. On that day, the area burned increased from an estimated 18,550 acres to 125,588 acres.
The 2016 survey did not predict how much the forest had changed by 2020. Surveying land for fire risk assessment is very labor intensive and takes a long time. It’s not uncommon for years to go by before another survey is conducted in a given area.
Satellite Images and Artificial Intelligence as Helpful Tools
NSF NCAR scientists called out the need for more up-to-date fuel data to better predict fire risks. More detailed information such as determining the density of trees in an area, the number of fallen trees, the conditions of the forest floor, and signs of drought or pest problems are vital pieces of information that help to better predict the chance of fire.
But how can we gather these data in a more timely manner? Researchers proposed an idea for how to get current, more detailed information using sources that are readily available. They used satellite images and special artificial intelligence (AI) to create a "fuel map" that shows forest conditions more accurately. Adding the fuel map data improved the accuracy of the fire model – the model outputs more closely matched what actually happened in the East Troublesome Fire. These tools provided a more accurate snapshot of the conditions and risk of fire.
This research helps to improve fire prediction and management for the future. While it’s a great step towards understanding wildfires, it’s important to note that wildfires can still be unpredictable. There are many stories of wildfires changing unexpectedly and rapidly without warning. More wildfire research will help to reduce this uncertainty and keep people safer from wildfires.