What Happens to Convective Storms in a Warmer Climate?
Learning Objectives
- Students will use models to explain convective storm formation and the effects of climate warming on precipitation.
- Students will interpret map data to identify patterns of changing storm severity due to climate change.
- Students will research credible sources to learn about storm hazards and design a way to communicate about storm safety.
Materials
- Stormy day timelapse video
- Make a Thunderstorm online interactive
- Student laptops or tablets with internet connection
For Convection Demonstration
- Mylar balloon filled with helium
- Drinking straw
- Hair dryer
- Video: Warming a Mylar Balloon
For Condensation Experiment
- 2 - 200 mL beakers
- 2 - 600 mL beakers or two plastic sandwich bags
- Hot water (approximately 150 mL)
- Ice water (approximately 150 mL)
- Red and blue food coloring (optional)
- Stopwatch or timer
Preparation
- Students should have some background knowledge of cloud formation, namely that warmed air carries water from the surface up into the atmosphere as water vapor, and then condenses back into liquid (or ice particles) to form a cloud because the air is colder at higher altitudes.
- If needed, show this YouTube video from NOVA Clouds and How they Form to provide background knowledge about cloud formation.
- Consider the Virtual Ballooning activity if your students need exposure to the connection between altitude and air temperature.
- Prepare the Mylar balloon in advance, if you are doing the demonstration. Tip: Prepare a few extra balloons in case the first one doesn’t function properly. Review the Supplemental Teacher video for tips related to the Mylar balloon convection demonstration.
- Print copies of the student sheet for each student.
- Gather materials for the condensation experiment. You will need water that is quite hot (use an electric tea kettle or microwave) and also ice water.
Directions
Introduction: Convection and Storm Formation (20 min)
- Write the question, “What happens in the atmosphere when a storm forms?” on the board and then tell students that they are going to watch a time-lapse video of a storm forming throughout one day. Draw a T-chart on the board and label one side What I Saw and the other What I didn’t See. Ask students to notice what they see happening, and also what is happening that they don’t see (ask them to think about the air and water molecules).
- Show the Stormy Day timelapse video. Consider showing it again to allow time for students to organize their thinking.
- Ask students to turn to a partner and share their ideas about what they saw and what they didn’t see that explains storm formation.
- Share some student ideas aloud and record in the T-chart on the board.
- Students should notice that clouds formed throughout the day until a rainstorm with wind happened, and then the sky cleared out towards the end of the day.
- Things that they couldn’t see are water vapor, evaporation at the surface, and condensation. They might also mention air molecules warming and rising, and then cooling and sinking.
- Summarize for students that for a storm to happen, there must be warm air that carries moisture up into the atmosphere to form clouds. Ask them to think about why this happens.
- Pass out the student activity sheets and tell them that they are going to observe what happens when a Mylar balloon filled with helium is heated.
- Students will record the experiment setup, observations during warming, and observations during cooling on their activity sheet (item 1).
- Do the Mylar balloon demonstration, or show the video instead.
- To prepare the balloon: Deflate the balloon by inserting a drinking straw three-quarters of the way into the hole near the base of the balloon. Lightly squeeze some air from the balloon but avoid emptying the balloon too much.
- Have a student volunteer warm the Mylar balloon using a hair dryer (this can take about 30 seconds), and then let go of the balloon. Explain that the balloon is representing a pocket of air located at the surface of Earth. The hair dryer represents thermal energy radiated from the ground.
- Have students make observations of what they see and hear happening to the Mylar balloon as the air inside is warmed (e.g., crinkling as it expands and travels up towards the ceiling) and add these observations to their activity sheets.
- Continue observing the Mylar balloon as it cools (roughly one minute or less). Once the air inside the balloon cools, it begins to sink and visibly shrink. Prompt students to add observations to their activity sheets. Repeat the demonstration a second or third time as needed.
- If you have an IR thermometer, consider taking temperature measurements of the balloon just before heating, as it’s being heated, and as it cools.
- Explain that the phenomena they are observing is called convection. Share other examples of convection that students may be familiar with (convection currents in Earth’s mantle, a convection oven for cooking, etc.). Explain that as molecules of air warm up, they expand and become less dense than the air molecules outside of the balloon, which causes them to rise. As they cool, they become more dense and sink.
- Energy from the Sun is absorbed by Earth’s surface. Heat radiates from Earth’s surface, causing air to warm and water near the surface to evaporate. The warmer, less dense air carries water vapor up into the atmosphere. At higher altitudes, the air temperature is much colder and causes the water vapor to condense into droplets of water. Those droplets collect to form a cloud. If enough water is carried up into the atmosphere throughout the day there will be a storm in the afternoon.
- A convective storm typically forms throughout a warm day, rain develops in the afternoon, and then clears by the evening.
- Have students answer questions 2 and 3 on their activity sheet, connecting the balloon demonstration to the formation of a storm.
Make a Thunderstorm (20 min)
- Students will use the Make a Thunderstorm online interactive and their student activity sheet to discover what atmospheric conditions are necessary for a storm to form.
- Orient students to the Make a Thunderstorm interactive. Make sure they understand the variables — they can manipulate the high-altitude temperature, humidity, and ground-level temperature. Encourage students to click on the question mark icons and to engage with the questions on the right side of the interactive for information that can help them figure out what is needed for a thunderstorm to form. Tell them to try at least four different experimental designs.
- Have students make a prediction (item 4) before they begin to determine which combination of variables will result in an intense thunderstorm. Explain that intensity is a way to describe storms. As a storm becomes more intense, it is likely to produce severe weather, such as strong winds, heavy rains, large hail, and possibly even tornadoes!
- Students should record their experiments and observations in the table (item 5).
- After students have experimented with the interactive, hold a discussion to ensure student understanding of the conditions needed for storm formation — high humidity and a large temperature difference between the sky and the surface. Have students complete items 6 and 7 on the activity sheet before moving on.
Convective Storms in a Warmer Climate: Condensation Experiment and Data Interpretation
- Now that we understand how convective storms form, let’s consider how storms are changing as a result of climate change. We know that Earth’s average global surface temperature has increased by about 1.1°C (2°F) since the industrial revolution. There is more heat in the atmosphere now than there was 100 years ago. Note: You may want to help students understand that while 1.1°C sounds like it isn’t very much, in terms of global change, this is actually significant.
- Ask students to share ideas about how storm formation might be affected by climate change, which is making the air warmer.
- Set up the demonstration and invite students to gather so that they can see clearly.
- Fill one beaker with ice water, and the other with hot water (use an electric kettle to heat the water in advance) as shown in the image below (left). Optional: Add 1-2 drops of blue food coloring to the ice water and 1-2 drops of red food coloring to the hot water to enhance the visual effect. If you don’t have beakers, use two identical drinking glasses.
- Simultaneously place the larger beakers over each of the smaller beakers as shown in the image below (right) and have students call out observations. You should quickly notice condensation forming inside the hot beaker setup. If the ambient air is quite warm, you may also notice condensation on the outside of the cold beaker, but it will take much longer to appear. If you don’t have large beakers, you can cover the hot and cold water containers with a clear, plastic sandwich bag.
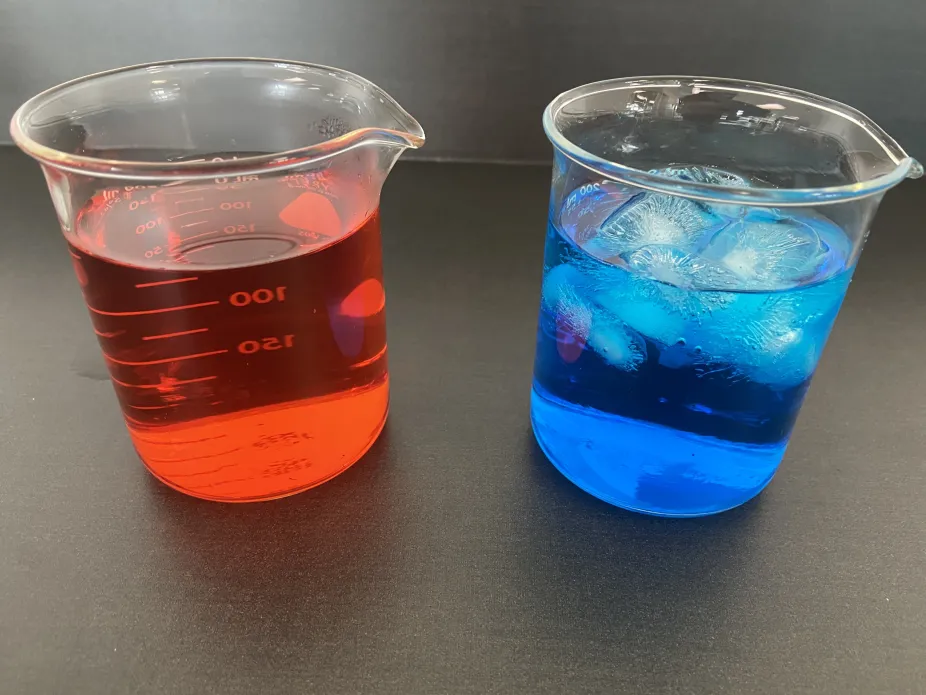

- Help students connect the condensation they are observing with storm formation. As the warm air rises, moisture held within the air condenses into water droplets on the cooler, outer beaker. In the cold beaker setup, the air holds less moisture so there isn’t as much condensation.
- Lead a discussion to help students understand that in a warmer climate, storms are likely to have more precipitation because warmer air can hold more moisture than cooler air — more moisture in the air means more fuel for precipitation.
- OPTIONAL: This demonstration could also be modified to provide an opportunity for students to practice experimental design by incorporating additional variables and data collection (e.g., measuring temperature, time, quantifying condensation, testing additional water temperatures, etc.), and could be done in student groups instead of as a teacher-led demonstration.
- Direct students’ attention to the three graphics from Climate Central on their activity sheet (items 8-11) and tell them that now we are going to look at some data about how storms have changed already, and how they are predicted to change. Give them time to interpret the data in those graphics and answer the questions.
-
Students should be able to connect the condensation experiment with the first graphic that describes how warmer air can hold more moisture and lead to heavier precipitation. For every 1°F of temperature increase, the atmosphere can hold 4% more water vapor.

-
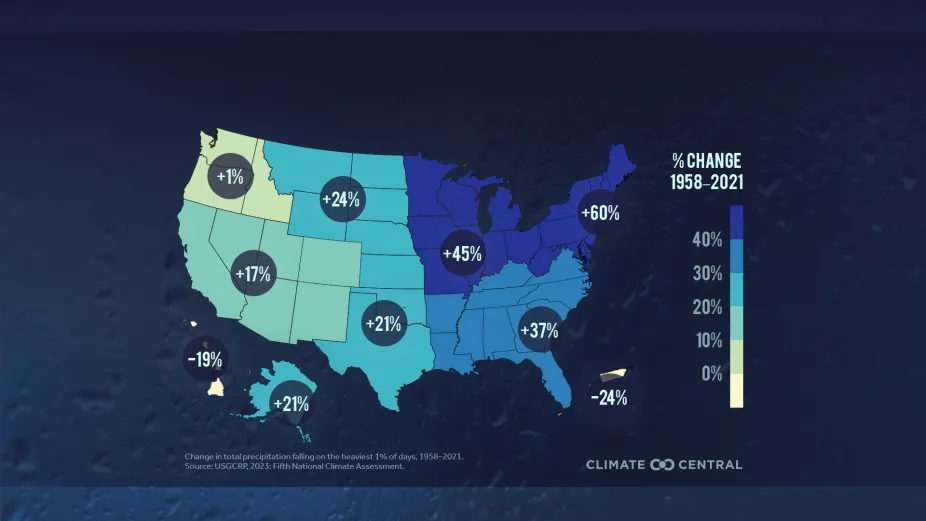
The heavier downpours graphic shows how we have already observed an intensification of rainfall, and also that some areas are experiencing a greater change than others. On days with the heaviest rainfall, the amount of precipitation has increased, which shows that severe storms are more intense.
-
The warmer future graphic shows how storms with the heaviest rainfall are expected to change under climate conditions with 2°C (3.6°F) of warming. Note that we are currently at about 1.1°C of warming. Students should again note that some areas will experience more change than others.

- For question 11, ask students to notice how storms have changed where they live, and how they are predicted to change. Connect to any recent stories of severe weather in your area, if applicable. Students should generate ideas about how intensification of storms might affect their community (e.g., more flooding in low-lying areas, more flash flooding).
-
Storm Hazards and Safety (30 min)
- Now we will transition to investigating storm hazards and safety. Review the information about the most dangerous storm hazards that is included on the student activity sheets (lightning, winds, hail, flooding, and tornadoes).
- Tell students that their task is to research storm hazards and storm safety using the websites provided on the activity sheet or other reputable websites (item 12) and come up with a pitch for how to share what they have learned in a creative way. Students can work in small groups and choose one of the top hazards to focus on (e.g., flash floods or tornadoes). Consider assigning topics to each group so a wide range of topics is covered.
- Students are just coming up with a plan, or a pitch, for what they would like to do. They don’t necessarily need to create their own creative video or skit, for example (though this could be a nice extension if time permits).
- Decide how students will share their pitch with the class — perhaps each group will design a slide or write ideas on a piece of chart paper to present.
- Each group should include a justification for why sharing about storm hazards is necessary and reference evidence from other parts of the lesson to support their justification.
- Reinforce that students should include the main ideas about the storm hazard and how to stay safe from that hazard in their pitch. Ask them to think about useful information to include and how to share it in a creative way that would appeal to their audience.
- Have each group present their ideas to the class.
- Hold a follow up discussion about how your class could share what they have learned with their families or the school community.
Extensions
- Research how storms are changing in your area. Have students brainstorm questions that they are curious about (e.g., How have the number of thunderstorms per year in our state changed over the past three decades?), and then research climate and weather data to find answers. Have students create graphs or visuals to show what they find. Note: You may need to prepare data sets for students to use in advance. The resources listed below have a large amount of data, but it is not necessarily prepared for students to use without developed data mining skills.
- The NOAA Regional Climate Center website may be a good starting place to identify climate data about your area.
- Many different types of data can be found on the National Weather Service website. Click on your area on the map, explore the Climate and Past Weather tab. You can refine your data search from there.
- The Storm Prediction Center website has downloadable data tables about conditions such as tornadoes, hail, and winds by state and year along with many data maps and visualizations.
- Learn about planting solutions for managing flooding from storm water, such as planting trees, planting a rain garden, or building a green roof. Have students draw a map of their school grounds or the block they live on and indicate places where planting solutions could be implemented. They should identify places where stormwater typically collects as good locations for planting. Suggested videos:
Background
How Convective Storms Form
Thunderstorms form when warm, moist air rises into cold air. The warm air becomes cooler, which causes moisture, called water vapor, to form small water droplets — a process called condensation. The cooled air drops lower in the atmosphere, warms, and rises again. This circuit of rising and falling air is called a convection cell. If this happens a small amount, a cloud will form. If this happens with large amounts of air and moisture, a thunderstorm can form.
Convective storms are typical on a day with significant humidity and warming temperatures throughout the day. The storm itself might occur in the late afternoon, with skies clear by the evening. These storms can be quite localized, causing precipitation in only a particular area but not across the entire region, for example. This differs from a frontal storm, which is due to the collision of large air masses of differing temperatures. Frontal storms often cover a large area, like an entire state, and can sometimes last for multiple days.
Make a Thunderstorm
The Make a Thunderstorm interactive allows students to understand how specific atmospheric conditions affect whether there is a storm or not, or whether a larger or smaller storm forms. When there is the greatest difference in air temperatures between the surface and higher altitudes, and when there is high humidity, the conditions are favorable for a large storm to form. Warm temperatures at the surface allow for evaporation and rising of warm, moist air. Colder temperatures in the upper atmosphere will facilitate cloud formation through condensation. And a source of moisture is needed to provide the humidity that leads to precipitation. Also necessary is a force to lift the moist air up into the atmosphere (such as converging winds), but this aspect is not apparent through the interactive.
Storms in a Warming Climate
Earth’s climate is warming due to burning fossil fuels that add to the greenhouse effect. As the atmosphere warms, the potential for more severe storms is a climate change impact that communities will need to plan for. This is because warmer air can hold more moisture than cooler air, as students will observe during the condensation experiment. When there is more moisture in the atmosphere, there is more potential for precipitation. According to information from Climate Central, for every 1°F of temperature increase, the atmosphere can hold an additional 4% more water vapor, which means there are increased chances for heavy downpours and flash floods. The U.S. has already warmed 2.6°F since 1970 — meaning our atmosphere can already hold about 10% more moisture than before. Since 1958, the most extreme precipitation days have intensified across the U.S., with the Northeast and Midwest experiencing the most increases in precipitation. This intensification is predicted to continue as the climate continues to warm.