Modeling Storm Surge
After reading about hurricanes and their impacts on the coast, students model conditions during a hurricane that produce storm surge and witness its impact on model coastlines.
Learning Objectives
- Students will use background knowledge and information from text to make inferences about what happened in a picture.
- Students will learn how storm surge forms during a hurricane.
- Students will build and test models of storm surge
- Students will consider how the shape of a coastline influences the amount of flooding and impact on humans caused by a hurricane’s storm surge.
Materials
For each student:
- Printed or online: How Do Hurricanes Form (article)
- Printed or online: Hurricane Damage (article)
- A 3-Column Note-taking page
For each group:
- A plastic plate with a line drawn around the inside of the rim with permanent marker
- Container of play-dough
- Six sugar cubes
- One cup of water tinted with blue food coloring
For the class:
- Hairdryer
- A baking sheet or plastic garbage bag
- Chart paper or whiteboard
- Computer/projector connected to the internet OR print-out of the images of Storm Surge from Hurricane Katrina
- Storm Surge Visualization video
- Coastline images (4)
Preparation
- Print out copies of the articles or provide students with URLs.
- Preview images of storm surge post-Hurricane Katrina, Storm Surge Visualization Video, and 4 images of coastlines
Directions
Engage: What happened here?
-
Project image of Storm Surge after Hurricane Katrina (or show color print out). Tell students this is a picture taken after Hurricane Katrina.
*note: it’s best not to tell students just yet what the pictures mean, allow their curiosity to engage them as they read about hurricanes in the next section! -
Activity: See-Think-Wonder.Using chart paper or whiteboard, make three columns (See, Think, Wonder). Ask students questions about the pictures and record student thinking during the discussion. What do you notice in the pictures? What do you think it means? What questions do you have?
-
Say: Let’s learn more about what happens during a hurricane so we can really understand the story these pictures are telling us.
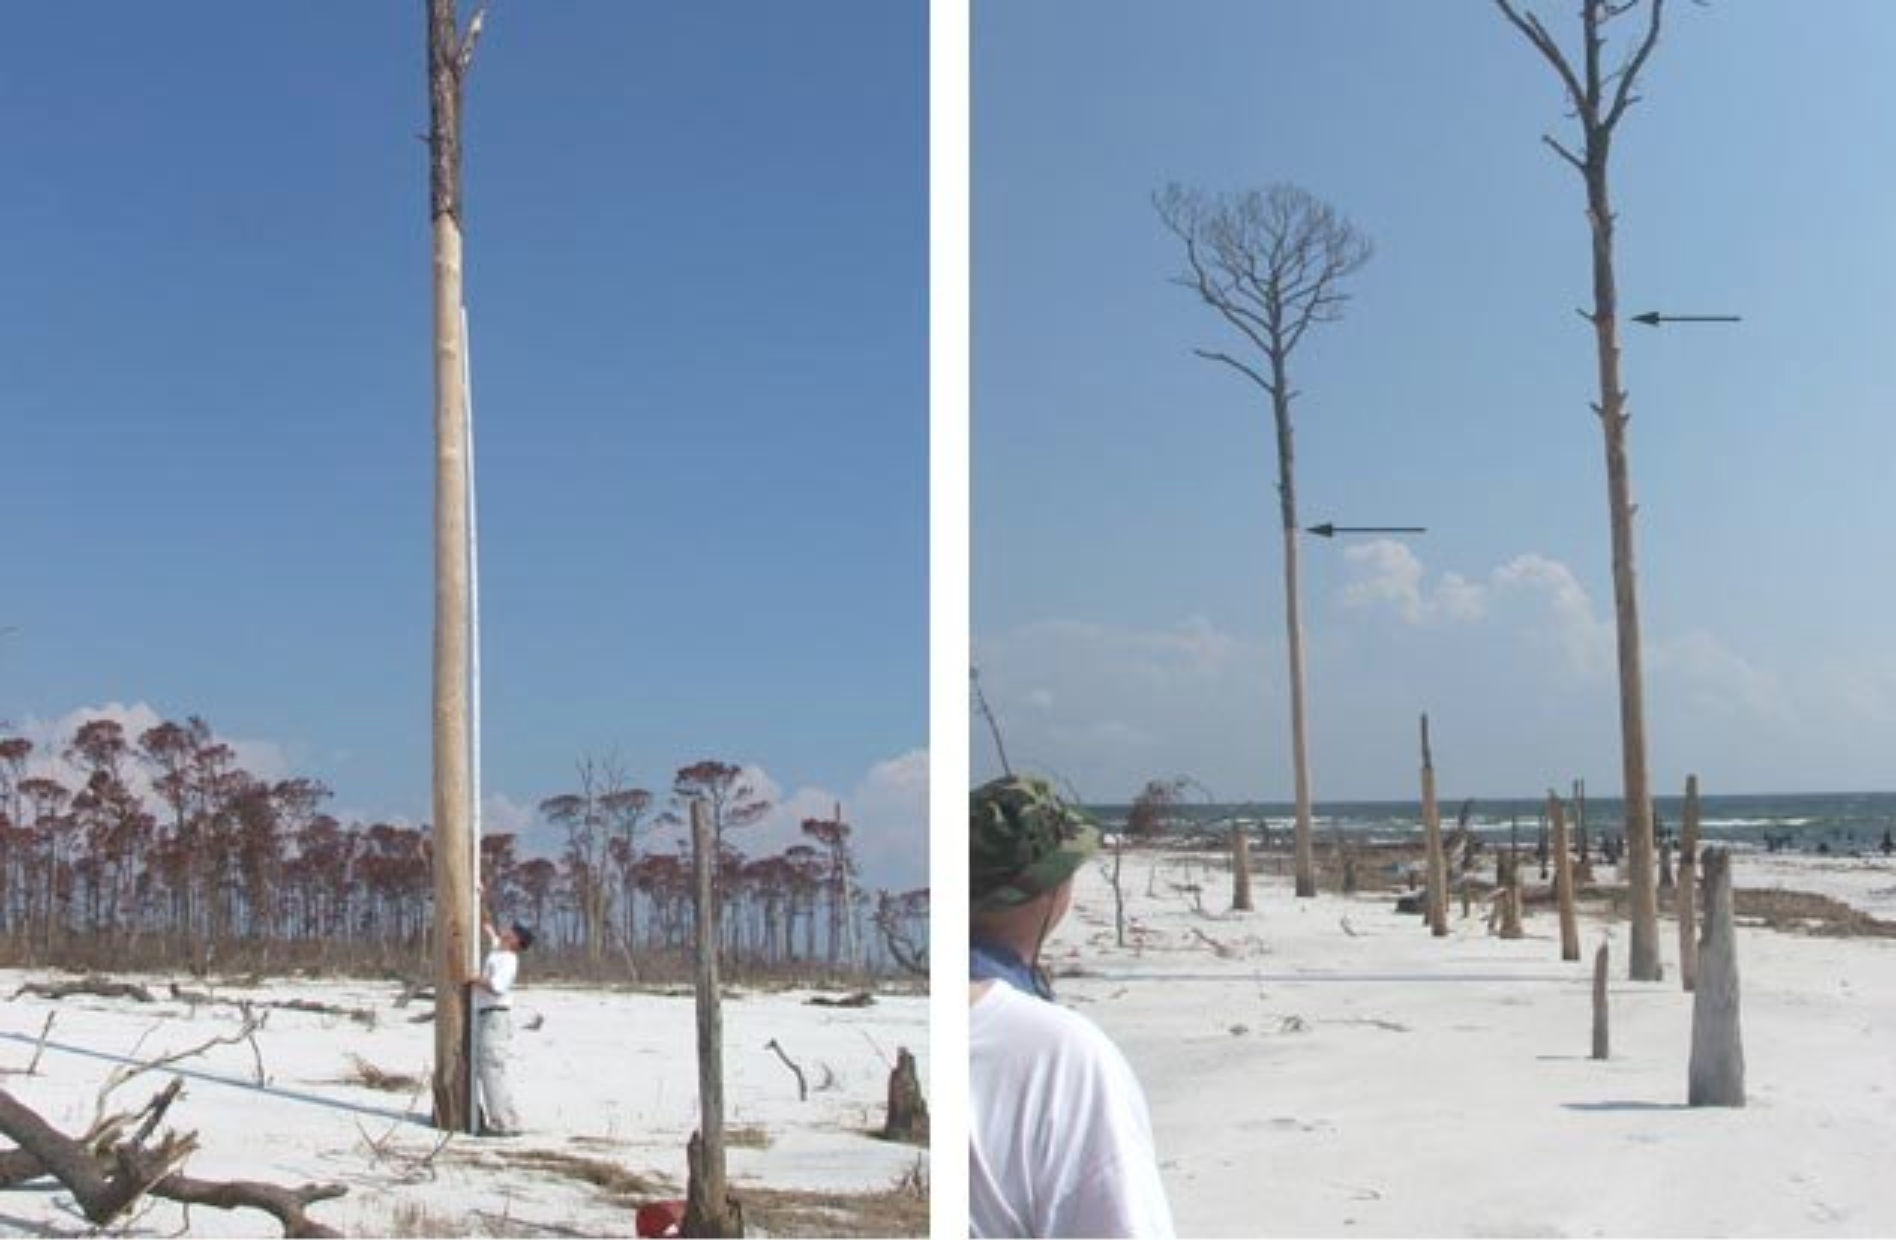
Images above: High water marks on East Ship Island, Mississippi, after Hurricane Katrina in 2005.
Left: Bark stripped off a tree with salt-burned pine trees in the background.
Right: Massive beach and over wash erosion illustrated by damaged and snapped pine trees along the beach. Arrows show the high water mark left by the storm surge.
Image credit: Fritz et al., 2007, "Hurricane Katrina storm surge distribution and field observations on the Mississippi Barrier Islands." More information here.
Explore: What happens during a hurricane?
-
Activity: Active Reading
-
Pass out the student pages: 3-Column Note-taking Student Sheet, How Do Hurricanes Happen, and Hurricanes Impact our Lives (one each per student).
-
Give students time to read the two articles and take 3-column notes individually (*note: depending on the reading level of your students, this could also be done with a partner or as a whole class with the teacher recording student ideas into the 3-column note document). Encourage students to take notes about important things they read in the text but also about things they see in the pictures and diagrams.
-
-
Discussion: Connecting the readings to the pictures of after Hurricane Katrina
-
Reference the pictures from the beginning of the lesson. Ask students to share something they learned from the readings that could explain what we see in the pictures. Guide the discussion with questions such as “What happens during a hurricane?” and “What is storm surge?” Capture student ideas in a list on the board/chart paper.
-
If it hasn’t come up yet, now is the time to focus on the high water marks and stripped tree bark visible in the pictures as evidence of storm surge. Share information from the captions of the pictures at this time.
-
Also, address any questions that students came up with during their reading/notetaking.
-
-
View the Storm Surge Visualization video with your students to show how storm surge can impact a coastal city or town.
Explore: Make a Model of Storm Surge
- Project different coastline pictures (some options below). Not all coastlines are the same, which ones do you think will be affected most by storm surge?

Almafi Coast in Italy. Credit: CIA

Coast of Isla Vista, California. Credit: USGS

Fort Lauderdale, Florida. Credit: City of Fort Lauderdale

Rhode Island Beach. Credit: State of Rhode Island
- Activity: Build a model.
- In small groups (4-5 students per group), students build a model of different types of coastlines to see what happens when hurricanes send storm surge onto the land.
Suggestion: assign each group a different coastline shape to build to ensure you have a variety of models to test.
- Provide each group with a plastic plate, a container of play-dough to form the land, and six sugar cubes, which will represent houses along the coast. Tell groups that the line on the plate is the level of the ocean water under normal high-tide conditions.
- Allow each group to create their coastlines with play-dough on one side of the plastic plate. Have students decide where to locate the sugar cube houses. Then have students fill the plastic plate with blue water up to the line.
- Make a chart on the board or chart paper to record results of the storm surge test. Have students discuss and agree on which data should be recorded in the chart.
Suggestion: Record whether any sugar cube houses were flooded, and how many if so. Record if water piled up along the coast. Record if there were any areas that were not flooded, and if so, where they were.
- Test student models one at a time. Gather the class around a model and allow the group to explain where they think there will be the most flooding and which areas will not flood. (As water will likely splash out of the plate, you may wish to put the models in a baking pan or plastic garbage bag before testing.)
- Aim the hairdryer so that wind blows across the “ocean” towards the “land”. The water will have nowhere to go and will pile up on the shore. The sugar houses that have been flooded will be blue in color and may start to fall apart.
- If you have time, groups can modify their models and test again. See if they can design a way to keep some areas from flooding!
- In small groups (4-5 students per group), students build a model of different types of coastlines to see what happens when hurricanes send storm surge onto the land.
Explain: Reflecting on the model activity
-
Pair-Share: Have students pair up with someone who was NOT in their group. Students take turns explaining why storm surge happens during a hurricane and how their model could help people learn how to stay safe during an actual hurricane.
Assessment
Have students write a letter to a fictional city planning office describing the risks their coastal town faces in the upcoming hurricane season. They can choose to write the letter as if they live in a town that is on a coastline similar to the one they built in class or chose a different type of coastline. Be sure to include a description of what might happen during the hurricane, why different parts of their particular coastline are at risk, and to propose some suggestions for how the town can help improve the safety of its residents.
Background
What is storm surge?
As a hurricane’s winds spiral around and around the storm, they push seawater into a mound at the storm’s center. This mound of water becomes dangerous when the storm reaches land because it causes flooding along the coast. The water piles up, unable to escape anywhere but onto land as the storm moves towards the shore. A hurricane will cause more storm surge in areas where the ocean floor slopes gradually.
When high tide happens at the same time as a storm surge, the combination of the two is called storm tide. During a storm tide, the water level may be 20 feet or more above normal. This causes huge floods. Storm tide is especially dangerous for flat islands or coastal areas where the land is not much higher than sea level.
What is a hurricane?
Hurricanes are huge storms. They can be up to 600 miles across and have strong winds spiraling inward and upward at speeds of 75 to 200 miles per hour. Hurricanes last for over a week, and they move over time. They move fastest over the open ocean (as fast as 20 miles per hour). With warm air at their centers, hurricanes are different from storms that happen in the middle latitudes like the United States.
The center of a hurricane is the calmest part. It is called the eye and has only light winds and fair weather. Winds of a hurricane blow counterclockwise around the eye at the Earth's surface in the northern hemisphere (clockwise in the southern hemisphere).
A hurricane dies when it moves away from the tropics. When a hurricane moves into areas with cooler ocean water, it weakens. It will also weaken if it travels over land.
Five things a hurricane needs to grow stronger:
- Hurricanes take energy from the warm ocean water to become stronger. While a hurricane is over warm water it will continue to grow.
- Winds flow towards the center of the storm low in the atmosphere and air is forced upward.
- High in the atmosphere, the winds flow away from the storm, which allows more air from below to rise.
- The air that rises needs to be warm and moist so that it forms the clouds of the storm. Warm, moist air is found above warm, tropical ocean waters.
- A hurricane also needs the winds outside the storm to be light. These winds steer the storm but are not strong enough to disrupt it.
What is going on with the storm surge model?
In this model, the blowing hairdryer is like the winds of a hurricane. Hurricane winds push water into a mound at the storm’s center. As the hurricane gets closer to the coast, the mound of water is unable to escape anywhere but onto land. A hurricane will cause more storm surge in areas where the ocean floor and coastal areas slope gradually.