Pika Data Detectives: Evaluating AI Science Claims
A simplified dataset on pika behavior in the alpine tundra provides an opportunity for students to critically evaluate an AI-generated interpretation of data and revise it through their own science reasoning and analysis.The activity helps students understand the impact of temperature on pikas as an indicator species.
Learning Goals
- Students will learn that as temperature increases, pika activity tends to decrease.
- Students will learn that pikas are an indicator species and are highly sensitive to temperature change in their environment.
- Students will use their skills of analyzing and interpreting data in order to evaluate a claim.
Learning Objectives
- Students will be able to describe the relationship between pika activity and temperature based on evidence from data and understanding of pika physiology.
- Students will be able to critically evaluate an AI-generated interpretation of data by determining whether the claims are supported by the evidence, whether the claims are accurate, and how the claim might be revised to better align with the data.
Materials
Preparation
- Print a copy of the student handout for each student.
Directions
Introducing Pikas
In this lesson, we will learn about a very cute mammal related to rabbits, called a pika. Pikas in the Rocky Mountains live solo in individual territories high up in the alpine tundra and spend most of the summer and fall gathering food for the winter. Alpine tundra refers to high-altitude, mountainous areas that are cold, windy, and have a short growing season.
- To learn more, we’ll watch a couple of videos on pikas. Pose this guiding question to students before playing the first video: Scientist Chris Ray says that a pika’s life could be a short one if it’s in a bad territory in the tundra. What would be considered a bad territory for a pika? What would that look like?
- Watch Meet Colorado’s Pika, featuring Chris Ray, a scientist who studies pikas.
- After viewing the video, have students discuss the guiding question and brainstorm the difference between a “good territory,” or habitat, vs. a “bad territory” for pikas. Answers could include:
| “Good” territory | “Bad” territory |
| Lots of vegetation | Little or no vegetation |
| Safe areas to escape predators | Limited areas to avoid predators |
| Deep talus areas with cooling vents | Shallow talus with few areas below the surface |
| Shaded areas | High sun exposure with little shade |
| Heavy snowpack to insulate their dens during the winter | Low snowpack or early snowpack melt resulting in more heat exposure |
| Diverse, healthy diet of vegetation to create haystacks | Limited, less nutritious vegetation for a poorer diet |
| Higher altitude area that is cooler | Lower altitude that is hotter |
- Let’s learn more about pikas by watching this second video. Call out the point that a warming climate greatly affects pika populations since they live in a specialized habitat.
Analyzing Data and Claims
- Share slides 1-3 to introduce the pika study:
- Phenomena: How does a change in temperature affect pika behavior?
- The Study: Researchers observed 42 different pikas during the summer. They recorded the average (mean) number of minutes each pika spent outside, on top of the rocks, during a 60-minute window at different temperatures.
- Share slides 4-7 and pass out the student handout. Have students call out things that they notice on both the data table and graph using a WIS-WIM analysis strategy to identify “What I see” and interpret “What it means.”
In the data table, the “Variation Range” tracks the full range of time that the pikas in the study were active out on the surface of the rocky talus. For example, this means that for Session 1, some pikas were active for as long as 10 minutes, while others were active for as long as 14 minutes — with the average being 12 minutes as shown in the “Average Activity Level” column of the table.
|
Observation Session |
Air Temperature (℃) |
Average Activity Level (Minutes per Hour) |
Variation Range (Low to High) |
| Session 1 (Chilly morning) |
9℃ |
12 min |
10 to 14 min |
| Session 2 (Cool morning) |
14℃ |
24 min |
21 to 27 min |
| Session 3 (Mild morning) |
18℃ |
18 min |
16 to 20 min |
| Session 4 (Warm afternoon) |
23℃ |
5 min |
4 to 6 min |
| Session 5 (Hot afternoon) |
26℃ |
1 min |
0 to 2 min |
| Session 6 (Extreme heat) |
27℃ |
11 min |
2 to 20 min |
In the graph, the variation range of pika activity is indicated by the red bars marked for each session:
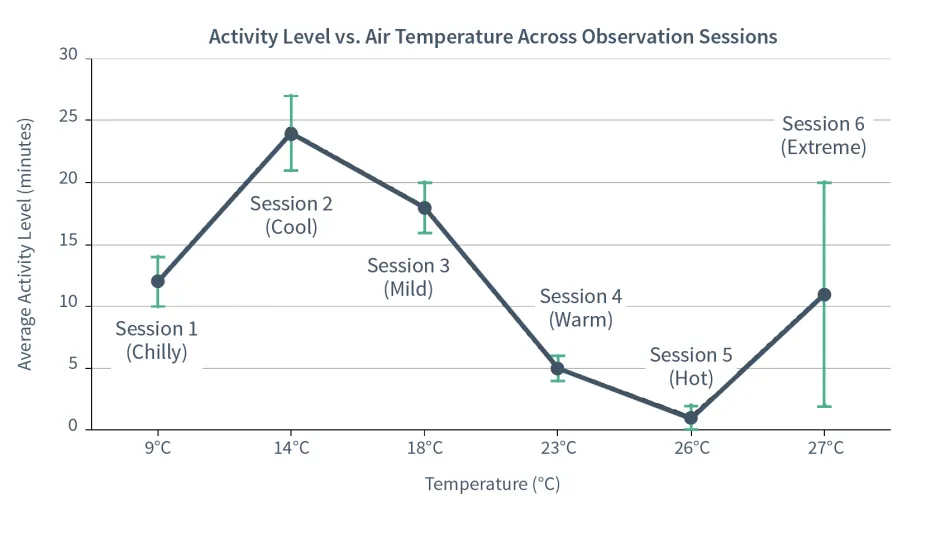
Activity level of pikas in a designated area vs. air temperature taken over 6 sessions
- Introduce the AI-generated interpretation of the data. Call out the importance of looking at AI outputs critically to determine their validity and the need to refine and revise them. Read the interpretation of the data generated by AI together as a class.
AI Data Interpretation Statement
Below is an interpretation of the data table and graph that was created using AI:
The data shows that pikas are successfully changing their daily schedules to survive rising alpine temperatures. A clear pattern in the data shows that pikas are most active during the cooler parts of the day, with activity peaking at 24 minutes when it is a mild 14℃.
However, when the heat becomes extreme, pikas know exactly how to handle it. Because above-ground activity jumps from 1 minute up to 11 minutes when the temperature rises from 26℃ to 27℃, the data shows that pikas have learned to safely tolerate temperatures up to 27℃ whenever they need to collect food.
- Have students annotate the AI-generated statement, using the annotation symbols listed on the student handout.
| Circle | A claim that is supported by the data |
| Underline | A claim that goes beyond the data |
| Star | A pattern you see in the data |
| Box | An anomaly* that the AI overlooked or needs to explain |
*An anomaly is something that is different or inconsistent. Look for something in the data that doesn’t fit the regular pattern.
- Based on their annotations, students will write out explanations for each of these and then create their own revision of their interpretation.
- Consider having students share their revised statements and discuss them as a group, narrowing down to a set of statements that everyone can agree upon.
- Have students answer the last question on the handout: How does a warming environment affect pika populations? What does this mean for other animals and plants in an alpine environment? To answer the questions, consider brainstorming with your students first about how a changing environment impacts ecosystems and as a result, the plants and animals that live there.
Teacher's Answer Key for Student Annotation
- Claim supported by data: Pika activity peaks at 24 minutes when the temperature is 14℃. (Session 2).
- Identifies a real pattern: Pikas are more active during the cooler parts of the day and less active when it warms up. (Overall trend of Sessions 1 through 5).
- Claim that overreaches: Because activity increased at 27℃, pikas "know exactly how to handle it" and have "learned to safely tolerate" that temperature.
- Students can mischaracterize animal behavior, describing it as "safe" or a "success." However, the data only tells us the pikas were outside for an average of 11 minutes with some outside for 2 minutes and others for as long as 20 minutes. It cannot tell us if they were safe, stressed, or overheating. In reality, 27℃ is a dangerous, potentially fatal temperature for them, and their brief emergence is a risky, desperate survival behavior — not proof that they tolerate the heat well.
- The anomaly in Session 6 (longer active times) can be attributed to pikas in duress due to the extreme temperatures or potentially the presence of a predator. This presents an opportunity for students to develop an explanation for the anomaly as well as pointing out how scientists discuss these sort of outliers in their research as places for further study.
Background
Pikas live in alpine areas of the Western United States and Asia. They are mammals in the order Lagomorpha and are related to rabbits. Unlike other alpine animals, pikas do not hibernate and usually live alone within individual territories. Throughout much of the year, they remain insulated beneath snow in rocky talus habitats. During the summer, pikas are busy gathering hay piles made of grasses, flowers, and other mountain plants, which they store in their dens to serve as food during the winter months.
Pikas are considered an indicator species because they are highly sensitive to changes in their environment. As habitat specialists, they thrive in cool, montane zones. Their high metabolic rate, combined with insulating snow cover, helps keep them warm in their dens throughout the winter — even though they do not hibernate. During the summer, pikas are very active. Each individual's territory averages ~500 square meters or ~5400 square feet (roughly the size of a full-sized recreational swimming pool), though this can vary depending on terrain and the availability of vegetation. Other animals, such as marmots and ptarmigans, also live in this environment.
Pikas cannot easily regulate their body temperature, so they rely on finding cool refuge from the Sun, such as shade or rock cover, to survive. During the summer, pikas are active in gathering hay piles but do most of this work during the cooler parts of the day. As temperatures rise throughout the day, they become less active. However, pikas have a strict upper temperature limit — brief exposure to temperatures above 25℃ (77.9℉) can be fatal. Consequently, pika populations are threatened by a warming climate, especially in alpine regions where opportunities to move to higher elevations are limited. Higher up, the land is even rockier, steeper, and colder, with only a few lichens and mosses growing. If pikas tried to move higher up due to the cooler temperatures, they most likely would not survive these even harsher conditions.
Pika populations in Nevada have already experienced a decline for this reason. In contrast, populations in the Rocky Mountain region have remained stable. However, recent research suggests that juvenile pikas in the Rockies have lower survival rates, as they must leave to find their own territory at an early age. Many do not survive the higher temperatures and exposure to predators encountered during their search for a new home. As an indicator species, pikas have been studied extensively to understand how rising temperatures greatly affect the biodiversity of our planet.
Creating an AI-Generated Science Claim
The claim and dataset for this activity were derived using generative AI. It is based on work developed by the Science & Technology Advancement Center (STAC). The lesson draws on STAC’s protocol for generating datasets and AI-generated claims and also adapts the broader instructional activity and supporting resources developed by STAC.
The process STAC uses can be used for any lesson of your choice. Having students critically evaluate AI-generated outputs is a fundamental skill that strengthens students’ ability to critically evaluate AI-derived information.
Use the STAC Protocol to Create Your Own Dataset and AI-Generated Claim
To create your own dataset and AI-generated claim, follow the protocol developed by STAC.
A few tips:
- Refer to the checklist on the last page of the protocol to make sure you’ve included all the components.
- The AI outputs don’t have to be perfect. Use of generative AI requires your expertise in editing and refining the outputs you get in order to meet the needs of your learning goals, lessons, and students.
- For the pika activity, we explicitly specified an AI query with data from real sources, most notably the Niwot Ridge Long-term Ecological Research Program (NWT LTER). We also took extra care to verify the information, referring to and researching multiple sources. The data presented here has been simplified to support learning and understanding.
References
Data for this activity is based on research described in the following papers:
- Ray, C. & Vidrio, J. (2025) Long-term data suggest a severe decline in recruitment of the American pika on Niwot Ridge, Boulder, County, Colorado, Arctic, Antarctic, and Alpine Research, 57(1). doi.org/10.1080/15230430.2025.2570526.
- Smith et al. (2016) Behavioral Ecology of American Pikas (Ochotona Princeps) at Mono Craters California: Living on the Edge, Western North American Naturalist, 76(4), pp. 459-484.
- Zhou, R. (2023) Daily and Seasonal Activity Patterns of Plateau Pikas (Ochotona curzoniae) on the Qinghai–Tibet Plateau, China, and Their Relationship with Weather Condition, Animals 18;13(10):1689. doi.org/10.3390/ani13101689.