Skip to main content
Main navigation
Center for Science Education
Contact Us
Search SciEd
Home
About
Collaborate with Us
Affiliations and Partnerships
Supporters
UCAR Center for Science Education Logo
Educators
Teaching Resources
School Field Trips to NSF NCAR
Join Us Virtually
Teacher Professional Development
Explore
Learning Zone
SkySci for Kids
Explore Virtually
Careers in STEM
STEM at Home
Visit
Visit NSF NCAR
Join Us Virtually
Exhibits
Visitor Accessibility
Events
Support Our Mission
Search SciEd
Contact Us
Image Gallery
10 images
Topic
- Any -
Air Quality
Clouds
How Weather Works
Storms and Other Weather
Earth as a System
How Climate Works
Impacts of Climate Change
Solving Climate Change
Layers of the Atmosphere
Sun and Space Weather
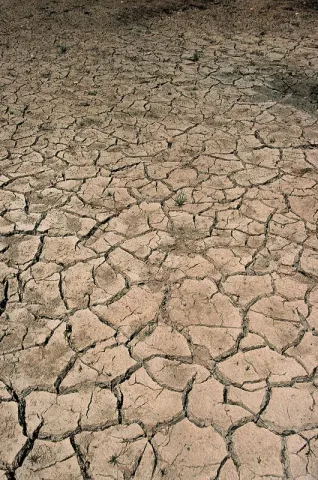
Cracks in Dry Mud
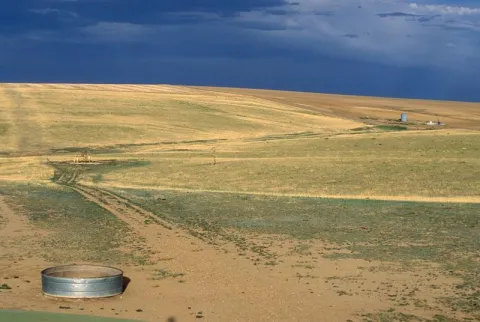
Drought in the central United States
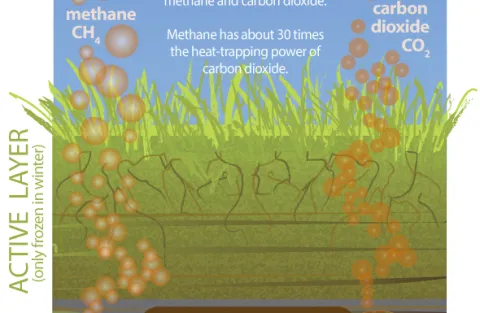
How Thawing Permafrost Soils Release Greenhouse Gases
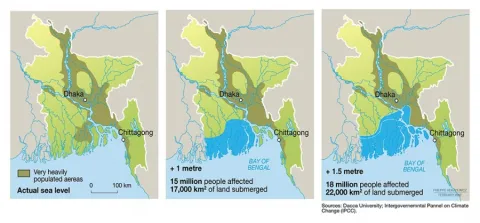
Sea Level Change in Bangladesh
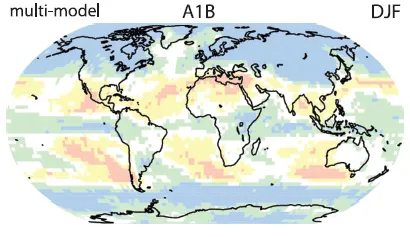
The Future of Precipitation
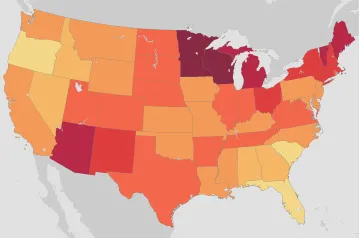
The New Normal: Changes in Annual Normal Temperatures
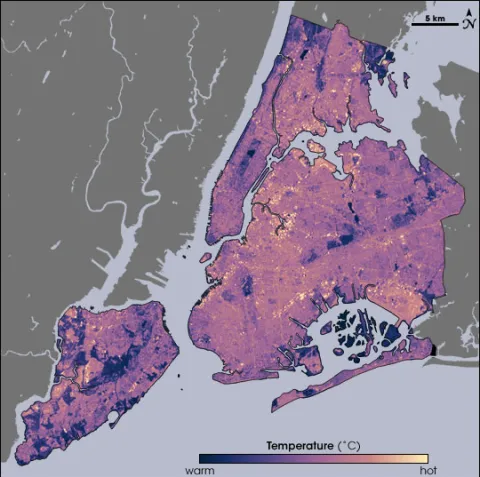
Urban Heat in New York City
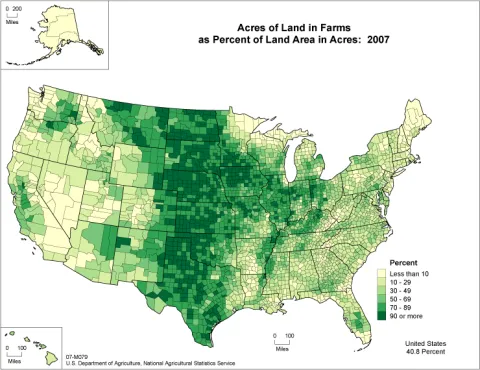
Where are the farms in the United States?
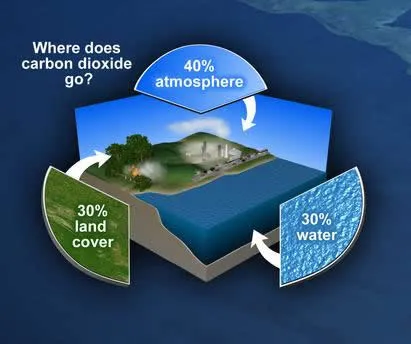
Where does carbon dioxide go?
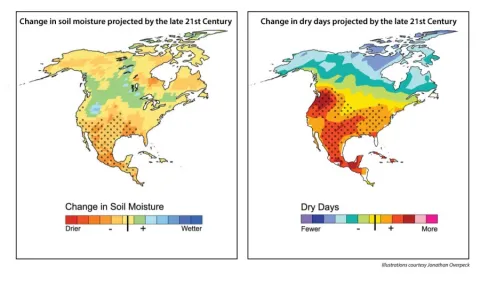
Which areas are projected to get drier?