Climate Variability
Weather can be highly variable on a daily, weekly, or even yearly basis – one day it might be sunny and the next it’s snowing. Climate, on the other hand, doesn’t change day-to-day because it is based on longer time scales and averages. However, climate is variable as well.
Climate variability is the way aspects of climate (such as temperature and precipitation) differ from an average. Climate variability occurs due to natural and sometimes periodic changes in the circulation of the air and ocean, volcanic eruptions, and other factors.
 |
For example, the average daily maximum temperature in July, averaged over 30 years from 1988 through 2017, in Boulder, Colorado was 87.7° F (30.9° C). However, in some years, the month of July has been warmer than the average. In other years, the month of July is cooler than the average. |
Worldwide, the average global temperature is rarely exactly the same from year to year. One year might be cooler than the year before, even though the long-term trend shows increasing temperature over time due to climate change. There are many reasons for climate variability, including natural fluctuations like the ENSO (El Nino Southern Oscillation). Scientists are currently researching the impact that climate change has on variability.

Climate variability is often natural, however climate change is causing an increase in the probability of many extreme weather events, and those events contribute to climate variability.
Extreme events are specific weather events that depart from the average in some significant way. For example, days that exceed 100° F (37.8° C) are called extreme heat events in many locations. While it's possible that any given summer day might be over 100° F, climate warming is causing the frequency of extreme heat days to increase. In other words, the probability of a summer day with extreme heat is becoming higher as climate warms.
Climatologists are concerned with more than temperature changes as climate changes. Extreme precipitation events are also important. Precipitation patterns that deviate significantly from the average can result in droughts or floods. The flooding in Texas in August 2017 caused by Hurricane Harvey is a recent and devastating example of an extreme precipitation event.
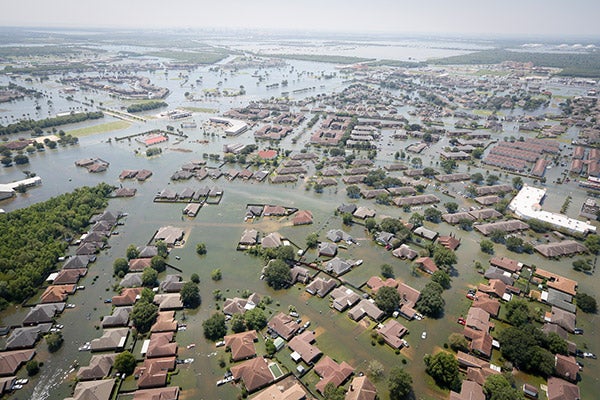
Flooding in Port Arthur, Texas during Hurricane Harvey in August 2017.
Credit: U.S. Air National Guard photo by Staff Sgt. Daniel J. Martinez.
Hurricane Harvey contributed to climate variability in 2017. The average August precipitation pattern for the thirty-year period from 1981 to 2010 for the United States was very different from the August precipitation recorded in 2017, as shown on the maps below. Note that although the color-coding of the maps shows a maximum value of 8 inches of precipitation, many areas around Houston received more than 30 inches (76 cm) of rainfall as a result of Hurricane Harvey... and one weather station recorded more than 60 inches (1.5 meters) of rain. Hurricane Harvey was definitely an extreme event!


The temperature data and precipitation maps used in this article were retrieved from NOAA's Climate.gov web site. The temperature data came from the Past Weather by Zip Code - Data Table section of the site. The precipitation maps came from the Data Snapshots section.