Rainfall & Flash Flooding
Goal
Students learn that storms with unusual amounts of rainfall can cause a flash flood.
Engage students with a map showing data about rainfall that caused flooding.
- Map of Precipitation Totals from the September 2013 Colorado Rainstorm: Heavy rainfall in Colorado during September 2013 caused widespread flash flooding. Instruct students to look at a map of rainfall totals in the area to learn how much water the storm dropped. Which areas got the most rain? Where would you predict the most flooding to occur? The rainfall totals on this map are provided by volunteer weather observers with the CoCoRaHS project.
- Watch the 3 minute CNN Colorado Flood Explainer video for a quick introduction to how such a large storm happened in Colorado during September 2013.
Explore how rainfall leads to flooding through one of the following investigations.
- Measuring Precipitation: Equipment and Measurements (CoCoRaHS Lesson 1): Students explore how rainfall is measured by taking readings from a rain gauge and reading about how one scientist struggled to measure rainfall during the Colorado rainstorm that produced floods.
- Conduct scientific measurements to determine the amount of moisture input to the local environment: Students can conduct the GLOBE precipitation and precipitation pH measurements, enter their data into the GLOBE database, and visualize their data.
- Reading: Measuring rainfall - it's easy and difficult at the same time, by Dr. Peggy LeMone
Elaborate by building student understanding of what is a normal or typical amount of precipitation for this region.
- Have students look for average precipitation in climate data from cities and towns they identify on the Google map of rainfall data. You can find weather data on the Weather Channel website by:
- entering a town and state into the search tool
- clicking “Monthly” on the left
- then clicking “Averages” below the calendar
- Explain that the averages tell us what is expected. They are an average of 30 years of data. Have each student group search for a different town and then report the difference they find between the storm totals and the average rainfall.
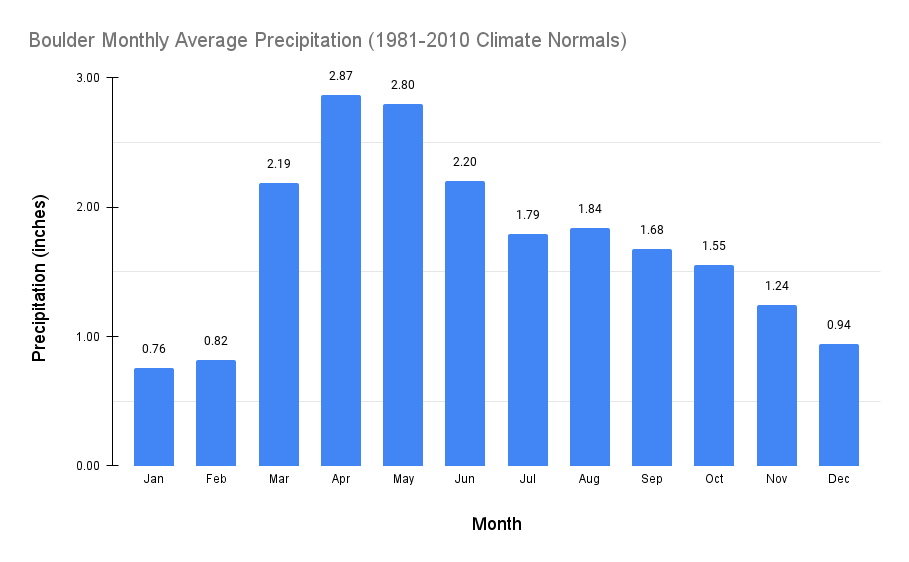
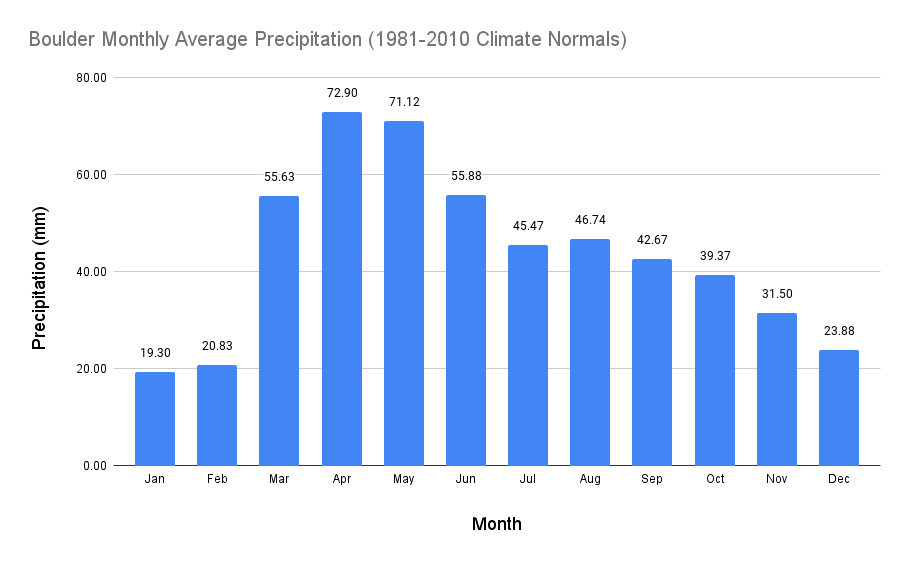
Evaluate student learning by comparing storm totals to averages.
- Have students compare the CoCoRaHS rainfall totals with a histogram of average precipitation for Boulder, Colorado.