The Very Simple Climate Model Activity
Using a simple online model, students learn about the relationship between average global temperature and carbon dioxide emissions while predicting temperature change over the 21st Century.
Learning Outcomes
- Students understand the impact of atmospheric carbon dioxide on Earth's global average temperature.
- Students understand that the amount of carbon dioxide in the atmosphere rises whenever emissions are greater than zero.
- Students understand how changes in the rate of carbon dioxide emissions impact the amount of carbon dioxide in the atmosphere and global average temperature.
- Students read and interpret graphs of data.
- Students develop an investigation using a model.
- Students present the results of an investigation to their peers.
Materials
- A computer or tablet with Internet access for each student pair
- Simulation: The Very Simple Climate Model
- Practice Scenarios: Future Climate: Explore the Possibilities
- Paper and pencils, poster board and markers, or presentation slides for optional assessment
Preparation
- Familiarize yourself with The Very Simple Climate Model simulation
- You may wish to plan additional activities or discussions about the greenhouse effect or sources of carbon emissions, depending on your students' familiarity with these topics.
- Depending on your students' math skill level, you may wish to introduce the concept of rate during Part 1.
Directions
Introduction
- Ask students to share what comes to mind when they think about climate change in the future. Consider making a list of student ideas on the board.
-
Tell students that one thing scientists are studying is how fast the climate is changing. Share the following quote with students about the future of climate change:
“Across the globe, in response to increases in heat-trapping gases such as carbon dioxide (CO2) in the atmosphere, temperature and precipitation patterns are changing. The rate of climatic change in the next century is expected to be significantly higher than it has been in the past. At our current rate of emissions, the Intergovernmental Panel on Climate Change (IPCC) estimates that CO2 levels in the atmosphere will double or triple during the next century, and the climate system will respond.” -NOAA
- Hold a brief discussion, asking students to share what they think the quote means.
- Discuss the role of greenhouse gases, such as carbon dioxide, in recent climate change. Also discuss sources of greenhouse gas emissions, such as vehicle exhaust, generating electricity from burning coal and natural gas, and manufacturing.
- Tell students that scientists use models to predict how Earth's climate will change in the future. Put simply, a computer model uses math to describe how the Earth works. Ensure that students have a good understanding of what a model is. Students could share examples of models that they are familiar with and compare them to computer models.
Interactive Activity: Part 1 - Learning how the model works
- Tell students that they will use a model to answer the question: How will the amount of carbon emissions released into the atmosphere affect the climate during this century?
- Consider posting this question on the board to reference throughout the lesson.
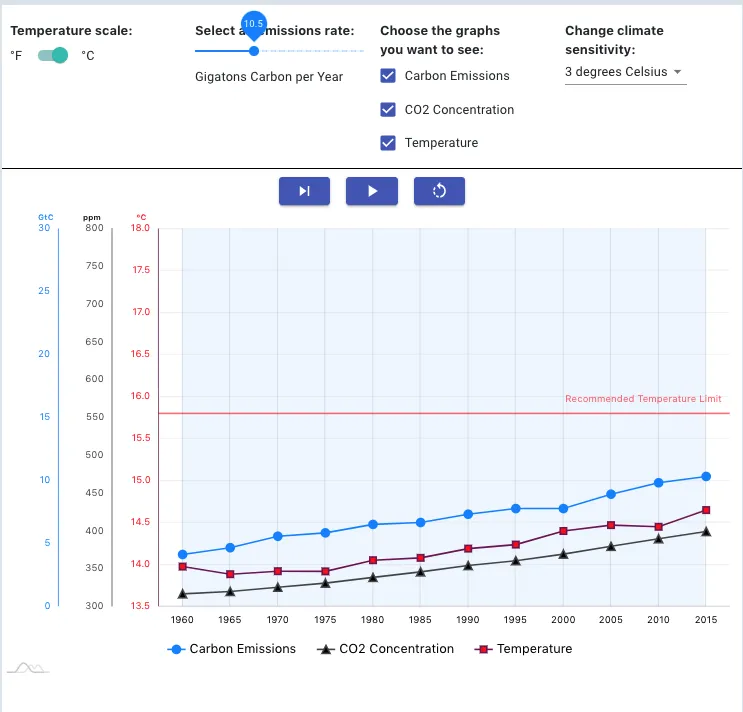
- Project The Very Simple Climate Model for students to see. Ask students to share what they notice about the model (they should notice that all three lines on the graph are increasing over time). Introduce the variables to the left of the graph (see figure below) that students can manipulate as they run the model.
- The carbon dioxide emissions rate is measured in gigatons of carbon dioxide per year.
- The emissions rate is initially set at 10.5 gigatons of carbon (GtC) per year, which was the actual rate during 2015. Note that this is not the same as gigatons of carbon dioxide, which totaled 32.2 GtCO2 in 2015 and 33.0 GtCO2 in 2021 (IEA, 2021).
- The climate change sensitivity is initially set at 3 °C. The climate sensitivity represents the amount of temperature change estimated to occur when carbon dioxide doubles. There is some uncertainty about how the climate system will behave as carbon dioxide increases, so scientists test models with different climate sensitivities.
- The recommended temperature limit line (15.81 °C) reflects 2 °C of warming above pre-industrial times, after which scientists predict life on Earth will be significantly impacted and it will be difficult to adapt.
 Select the step forward button to advance the model by 5 year increments.
 Select the play button to advance the model through the end of the century, 2100.
 Select the reset button to restart the model from the year 2015.
- Click the play button to see what will happen to Earth's temperature through the 21st century if each year we release the same amount of carbon dioxide into the atmosphere as we did in the year 2015 (10.5 GtC/yr).
- Three points will appear on the graph for every five years of model time. The color of these points correlates with the colors of the three y-axis measures.
- Discuss as a class what this graph is showing.
- The blue circles (emissions rate) represent how much carbon we add to the atmosphere each year. Since the rate stayed the same for this model run, the blue circles form a horizontal line on the graph.
- Black triangles represent how much carbon accumulates in the atmosphere over time. Units are "parts per million by volume" (ppmv). For reference, the actual concentration was 399.4 ppmv in the year 2015. In this run, the concentration rises from just under 400 ppmv to about 571 ppmv by the year 2100.
- Red squares represent average global temperature in degrees Celsius. For reference, this value was around 14.65 °C in the year 2015. In this model run, the temperature steadily rose to about 16.2 °C by the year 2100. This surpassed the recommended temperature limit by 0.4 °C.
- In this simple model, the temperature is determined entirely by the atmospheric CO2 concentration via greenhouse warming of the atmosphere.
- Give each pair of students a computer or tablet, and give them time to work through the three scenarios from the Future Climate: Explore the Possibilities page using The Simple Climate Model simulation.
- You may wish to have students write down the answers to the questions that are asked throughout scenarios 1-3.
- Remind students of the question that was posed at the beginning of Part 1: How will the amount of carbon emissions released into the atmosphere affect the climate during this century?
- Hold a discussion to discover what students have learned about the relationship between CO2concentration and global average temperature.
- Ask students to consider: “Why does temperature continue to rise even if emissions are decreasing?”
- Have students share what they discovered from Scenario #3: How much do emissions need to decrease to stay below 2° C of warming?
- Ask students to consider the importance of timing: Is a gradual reduction in emissions over time enough? Or do we need a rapid reduction to meet our goal?
- Share that scientists expect temperatures to rise 3 °C every time the CO2 concentration doubles (given a climate sensitivity of 3 °C, which scientists predict is likely). Discuss some of the effects that the warming climate has on people and ecosystems: drought, increased severity of hurricanes and tropical storms, extinctions, spreading or declining species ranges, sea level rise, etc.
Interactive Activity: Part 2 - Testing different scenarios of climate change
- Tell students that the actions of humans are the largest unknown when it comes to future climate change. Survey student opinions about how people are likely to behave in the future:
- Will we release the same amount of carbon dioxide into the atmosphere that we do now?
- Will we release less?
- Will we release more?
- Brainstorm how and why carbon emissions may change in the future. For example, as the global population increases, so does the demand for energy. Carbon emissions will go up if more power plants are created that burn fossil fuels, yet carbon emissions will go down if more technologies are invented that reduce the use of fossil fuels.
- Based on the survey and brainstorms, have students work in groups to come up with a scenario that they would like to test using the model. (Example: carbon dioxide emissions rise through the middle of the 21st Century, and then decline after that.) To be somewhat realistic, they should start with emissions around 10.5 GtC/yr since that is what it was in the year 2015.
- To help students focus as they run the model, have each group come up with a question that their scenario will answer.
- Have each group describe their scenario in a paragraph before they begin.
- After investigating their question with the model, have each group prepare a five minute presentation about their scenario to share with the class during the next class period. They should create 1-2 slides or a poster as a visual aid. Their presentation should include:
- The question they are trying to answer
- A description of the scenario they tested with The Very Simple Climate Model
- An explanation of what the model showed and what it means
- What new questions they have as a result of their investigation, and/or what steps they could take next to go further
Interactive Activity: Part 3 - Sharing what we have learned with our peers
- Each group should take turns presenting their scenario to the class. Allow time for questions & answers following each presentation, if possible.
- Discuss as a class the results of various student scenarios:
- What happened to temperature and carbon dioxide concentrations over time?
- Is some global warming inevitable?
- Which scenario had the least warming? Which had the most?
- Discuss the limitations of The Very Simple Climate Model. Ask students to consider where The Very Simple Climate Model is accurate and also where it is oversimplified.
- As a simplified model, many factors that influence climate such as changes in clouds and weather, changes in the amount of sea ice (which reflects sunlight), changes in air pollution and aerosols, changes in the amount of forests (which pull carbon out of the atmosphere), the effects of other greenhouse gases, or where CO2 is in the atmosphere are not considered here.
- If you have time, share an example of a more complex model of climate change used by scientists. Consider one or more of the model visualizations provided below, comparing/contrasting them with the Simple Climate Model used in this activity.
Climate model visualization options:
- Present and Future Climate in a Global Model
- Annual CCSM4 Global Surface Temperature Anomaly, 1850-2100
- Planetary Water Vapor
*Note: The above model visualizations show model data through time and across geography. The model data presented in The Simple Climate Model included global averages so there is change over time but no change across geography. To avoid confusion, ask students to focus on the different types of data that the models are showing. Ask students to imagine how the data in the Simple Climate Model might look as a visualization (increases in temperature could be shown as a change in color, for example).
Background
Climate scientists use models to understand how the Earth is changing. Models of Earth can be experimented upon to assess the impact of changing factors - such as increasing global temperature, decreasing ice sheets, or increasing cloud cover - on the planet. Climate models describe our planet with mathematical equations. Because Earth is complex, it takes hundreds of very complex equations to model the atmosphere, oceans, and land surface. Because of the complexity, climate models are usually run on powerful supercomputers.
The Very Simple Climate Model is, as the name implies, very simple. In this model, average global temperature is determined entirely by the atmospheric carbon dioxide concentration via greenhouse warming of the atmosphere and uptake of carbon dioxide by the ocean and biosphere, which are kept constant through time. The impacts of changes to the biosphere (such as changes in land use), changes in clouds and weather, other greenhouse gases, and other factors are not considered by this very simple model.
George E.P. Box once said, "all models are wrong, but some models are useful." The more a complex system like Earth is simplified in a model, the more wrong the model is. However, in simplifying this model to temperature and carbon dioxide, The Very Simple Climate Model allows students to focus on the cause and effect relationships of greenhouse gases and climate change. A major educational point embodied in this model is that temperatures depend on CO2 concentration, which rises whenever emissions are greater than zero. When you hear world leaders saying that they are working hard to reduce the rate of growth of greenhouse gas emissions, remember that reducing the rate of growth does not lead to reduced temperatures. Instead, the amount of greenhouse gases continues to grow in the atmosphere whenever emissions are greater than zero.
The assumptions behind this model, though rather limited, are valid as far as they go. The starting values for CO2 concentration, carbon emission rate, and temperature are right around actual values for the year 2015. The ranges for emission rate choices are in line with predictions scientists think we are likely to see in this century. The relationship between atmospheric carbon dioxide concentration and temperature is well-established; basically, temperature rises about 3° C for each doubling of carbon dioxide concentration. So, for example, if the concentration goes from 400 ppmv to 800 ppmv, we expect to see temperature go up by 3° C. As a reference, pre-industrial CO2 concentrations were at about 280 ppmv, compared to about 400 ppmv in 2015.
According to the Intergovernmental Panel on Climate Change (IPCC) and their 2014 Assessment Report, Earth's average temperature rose 0.6° Celsius (1.1°F) during the 20th Century. Based on the results from about a dozen computer models, the IPCC projects that global warming will continue. Model results project that Earth's average global temperature will rise between 1.8° and 4.0° Celsius (3.2° and 7.2° F) during this century, depending largely on whether humans change their actions to reduce carbon emissions, and if so, by how much.
Details of the Math Behind the Model
How does the CO2 emission rate affect the CO2 concentration?
About 55% of the emissions are absorbed by the ocean and biosphere, which means that 45% of the emissions wind up in the atmosphere. Every 2.3 GtC of the emissions that wind up in the atmosphere would raise atmospheric CO2 concentration by about 1 ppm based on estimates of the total quantity of CO2 in the atmosphere (in gigatons, abbreviated GtC) and of the CO2 concentration.
For example, if emissions were 10.5 GtC, 45% of that would end up in the atmosphere, which is 4.725 GtC. We would expect the CO2 concentration to rise by about 2 ppm ( = 4.725 GtC ÷ 2.3 GtC = 2.05) that year. Total global carbon emissions were around 9.2 GtC by 2006 and increased to 10.34 by 2015.
Also note that a very small amount of carbon (about 0.1% per year) finds its way out of the atmosphere naturally, which is also included in this model.
How does CO2 concentration affect temperature?
We know how much Earth's surface temperature will rise as CO2 levels increase based on both theory and observations. In general, doubling the atmospheric concentration of CO2 causes a certain amount of rise in average global surface temperature. The amount of temperature rise with double the CO2 is called the climate sensitivity.
According to the Sixth Assessment Report by the IPCC (Intergovernmental Panel on Climate Change), the climate sensitivity value is "likely to be in the range 2 to 4.5° C with a best estimate of about 3° C, and is very unlikely to be less than 1.5° C. Values substantially higher than 4.5° C cannot be excluded, but agreement of models with observations is not as good for those values." We have used 3° C for climate sensitivity in this simple model.
An example, if the CO2 level was 380 parts per million (ppm) when global average temperature was 14.5° C, and then the CO2 concentration rose to 760 ppm (2 x 380 ppm), we would expect global temperatures to rise roughly 3° C (5.4° F) to 17.5° C.
The formula used in the Very Simple Climate Model
| T = T0 + S log2 (C / C0) |
|
In the Very Simple Climate Model, the values for T0 and C0 are from the previous calculation. Calculations are made at five-year increments.
Teaching Tips
More Sample Model Runs
There are a few common types of carbon emission level scenarios your students might try with this simple model:
- What if carbon emissions were held at current levels?
- What if carbon emissions continue to rise?
- What if carbon emissions continue to rise during the first part of the 21st century, then are held stable or even reduced in the latter part of the century?
There are some important features of each of these scenarios, largely independent of the exact values used, that you might want to point out to your students.
- When CO2 emissions rise steadily, atmospheric CO2 concentration rises at an accelerating pace (its curve "bends upwards").
- Temperature rises less sharply than atmospheric CO2 concentration. This is because one must double the CO2 concentration in order to generate a fixed 3° C (or whatever climate sensitivity value you employ) increase in temperature.
- Even if emissions are reduced to zero, in this model the atmospheric CO2 concentration and temperature will not go back down. This simple model has, effectively, an infinite residence time for CO2 in the atmosphere.
Extensions
- Have students explore the question: Why do increasing global temperatures matter? Use the NASA resource A Degree of Concern: Why Global Temperatures Matter to learn about the changes that are predicted with specific amounts of global temperature increase.
- Have students make two lists as they read through the information: one for the effects of 1.5°C of warming and one for the effects of 2°C of warming.
- Students should compare their lists, focusing on where these changes will occur and how human populations will be affected.
- Explore Stabilization Wedge activities and resources from Princeton University's Carbon Mitigation Initiative (CMI).
Related Resources
- Interactive - Compare Emission and Temperature Scenarios from the IPCC (the Intergovernmental Panel on Climate Change)
- Carbon/Climate Bathtub Model for Atmospheric Carbon Dioxide Concentrations
- Global Energy Review (IEA, 2021)
- Carbon Cycle Diagrams