Storm Data for Student Analysis
Choose your hurricane data.
Below you will find the hurricane data that students analyze in Lessons 4 and 7 of the Hurricane Resilience curriculum. Choose one of the seven regions and download the Storm Data Cards and Warmed-up Storm Data Cards for that region. If there is a region that includes or is near your school location, using that data will help keep students’ experience focused on their location and community. You'll find a description of the data sources in the About the Data section below.
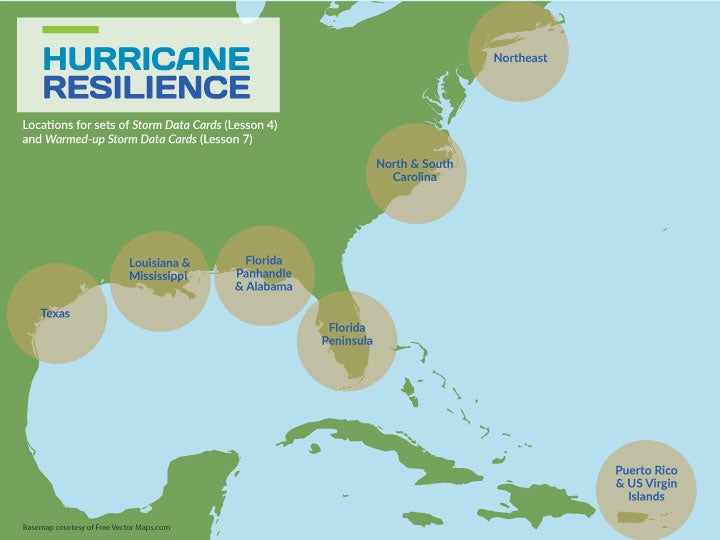
Locations of Storm Data Cards and Warmed-up Storm Data Cards for use in Lessons 4 and 7 of Hurricane Resilience.
Credit: UCAR with basemap from freevectormaps.com
Select a region and download.
The Storm Data Cards are for Lessons 4 and 7 and the Warmed up Storm Data Cards are for Lesson 7. You will only need the cards for one region.
All files linked below are in PDF format. ![]()
Texas
Louisiana and Mississippi
Florida Panhandle and Alabama
Florida Peninsula
Puerto Rico and the US Virgin Islands
North and South Carolina
Northeast
About the Data
The hurricanes and tropical storms that students explore in Lessons 4 and 7 of the Hurricane Resilience curriculum are past (historical) storms that caused major disaster declarations in the United States. Because of this, there are different numbers of storms in each collection. See the instructions for Lesson 4 for more information about how to orient students to the data. Below is additional information about the data sources.
Wind maps
The wind speed maps that students analyze were produced at the National Center for Atmospheric Research from computer simulations of historical storms. These simulations apply a spatial wind field along the storm track data from the National Hurricane Center (NHC). The historical storm track data is a combination of satellite data, Hurricane Hunter aircraft data, and data from surface observing stations, and shows the path that the hurricane traveled across the ocean and land. The spatial wind map shows wind speeds at different locations, and is based on a scientific understanding of how hurricane winds increase as you get closer to the storm and then suddenly drop to calm conditions within the hurricane eye. Each map shows the swath of maximum winds as a storm moves and approaches landfall. The maps also contain data on the peak wind speeds at the time of landfall and how fast the storm is moving forward. Data on wind speeds of recent storms are available in NHC Tropical Cyclone Reports.
Water level data
Peak water level data were obtained for historical storms from NOAA’s Tides and Currents. Archived data are available in Water Level Reports, where users can view maps of measurement station locations, see photos of the stations, read information about the instrumentation, and explore real-time and historical water level data at each station.
Peak water levels were calculated using the mean sea level as the baseline water level. For each storm, the database was scanned for all active station locations within approximately 400 km of the landfall location. The number of data points per storm varies based on the number of stations in a particular area. The peak water level during the month that the storm occurred was assumed to be a result of the storm. Water level data is measured in feet above mean sea level. An increase in water level during a storm might cause minor flooding or major flooding depending on the geography and topography of a coastal area.
Note that peak water levels in this dataset may not match peak water level values reported about the storms elsewhere. This dataset is based on archived data from stations that reported during the storm. It does not consider stations that became unable to report due to the storm and it does not consider other data sources such as high-water marks on buildings and other structures, which may be higher than water levels reported from stations.
Rainfall maps
The rainfall maps were obtained from the National Oceanic and Atmospheric Administration’s Weather Prediction Center and were made using rain gauge data from the National Climatic Data Center. A statistical method called “interpolation” was used to create the rainfall maps from the gauge data, estimating rainfall between the data points. You may wish to use the link above to find maps for additional storms that occurred in your location. New maps are added to the NOAA website, but it may take a few months after the event for them to become available.
About the warmed-up storm data
We know that storm wind speeds will increase in a warming world because hurricanes obtain their energy from warm ocean water, and thus, warming ocean water will increase hurricane wind speeds. There is scientific consensus that hurricane wind speeds increase by approximately 5% per degree Celsius of warming. Storm winds, therefore, would increase by 10% with 2°C of warming. As an example, Hurricane Michael (2018) brought peak winds of 153 mph at the time of landfall to Florida. If Hurricane Michael happened in a 2°C warmer world, peak winds would be 168 mph (153 x 1.10). Damage increases three times as fast as the rising wind speeds, so a 10% increase in wind speed would increase wind damage by 30%. Note that this change in wind speed ignores any other potential changes to hurricane winds in a warmer world. For example, it’s possible that the eye width and forward speed may change. Scientists are currently working to understand these possibilities.
« Back to the Hurricane Resilience curriculum
© 2020 UCAR