Global Temperatures Keep Breaking Records
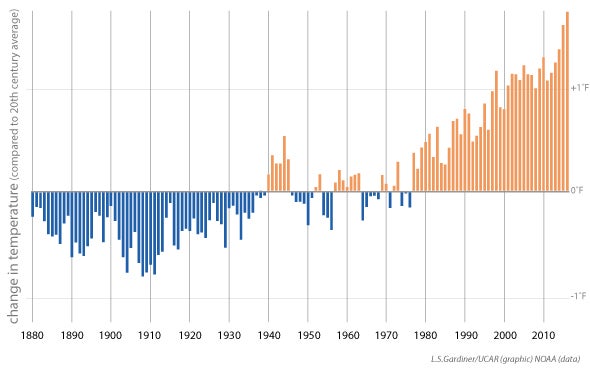
Earth is warming. While there is some variability year-to-year, the most recent years have been the warmest on record. The average global temperature in 2016 was 1.0°C (1.8°F) warmer than the 20th Century average. Global average temperatures were nearly as warm in 2020 at 0.98°C (1.8°F) above average.
How is Earth’s temperature monitored?
Each January the global average temperature is calculated for the previous year. The calculation takes into account temperature measurements collected from just above the surface at thousands of locations around the world each day.
These daily temperature measurements from around the world are compared with the usual temperature at each location for each day of the year. (Usual temperatures are based on the average over 30 years.) Then, values are averaged to calculate how much the temperature differed from the average over a whole year.
- How to Measure Global Average Temperature in Five Easy Steps
- Explore the temperature measurements: NOAA Climate Data Online

Average global temperature for each year from 1880-2016 shown as the amount of change in temperature as compared with the 20th century average temperature (center horizontal line). Years that were cooler than average are shown with blue bars. Years that were warmer than average are shown with orange bars.
UCAR
Does a degree or two make a difference?
The average global temperature takes into account all of the temperature measurements from around the world and at all times of year. A small change in the average temperature can mean dangerous record heat in certain locations and at certain times of year and less of the cold weather that keeps mountains capped with snow and keeps glaciers from melting.
Is next year going to be warmer than this year?
Not necessarily. Because climate change is causing temperatures to warm, it’s likely that next year will be warmer than this year. But climate variability, which is unrelated to climate change, can cause some variation in temperature year to year regardless of the trend. Overall, the trend shows increasing temperatures over time. In fact, the global temperature has been warmer than average for over 40 years.

While average global temperature varies a bit each year, which is climate variability, the overall warming trend is climate change. The five-year mean temperature (red line) shows the trend of climate change better than the yearly numbers.
UCAR
Is it warming everywhere?
The average temperature of the planet is rising, but some places are warming more than others. The map below shows how temperature around the world changed over 115 years.

Between 1900 and 2014, areas in red have warmed the most. Areas in orange and yellow have also warmed, although not as much. Areas in white have not warmed and areas in blue had cooled. Gray indicates places where we need more data in order to identify a trend.
NOAA
Keeping track of our planet’s temperature over time lets us know how climate change is affecting regions and Earth overall. Just as taking your temperature when you have a fever helps you and your doctor know what treatment is needed, taking Earth’s temperature helps all of us know what treatment is needed to break our planet’s fever and what steps regions need to take to adapt to climate change. Visit the Solving Climate Change section to learn more about actions to stop climate change and adapt to its effects.