How climate affects clouds and weather
Goal
Engage students by having them observe clouds in the local environment.
Make cloud observations
Start the module with an outdoor learning experience where students make observations of clouds.
- Download the GLOBE Observer Clouds app to mobile devices before class and create a login. (Use the UCAR Cloud Viewer or the GLOBE Cloud Chart If mobile devices are not available.)
- If you are having students use the app, show the class the GLOBE Observer Clouds: Getting Started video (2:35) before heading outside.
- If needed, make the arrangements required by your school to go outside during class. Plan to make cloud observations in an outdoor area that is safe and has a good view of the sky. Watch the weather forecast for a day when students are likely to see clouds.
- Before you head outside, survey student knowledge about cloud types and orient students to the cloud identification tools. Students have often learned about cloud types in middle school, but if understanding is uneven, review the cloud types with students. Students might also need a reminder about the meaning of the terms transparent, translucent, and opaque, which are a part of their GLOBE Observer observations.
- Head outside and have students work in groups to make cloud observations using GLOBE Observer or the Cloud Viewer or Cloud Chart. Instruct students to identify cloud types that they see, estimate the amount of cloud cover, and to never look directly into the Sun as they are making cloud observations.
- (Note: If you are unable to go outdoors, a large classroom window with a view of the sky could be used as an alternative.)

The GLOBE Observer Clouds app helps students make cloud observations and identify cloud types while they are collecting data as citizen scientists. Students will use cloud data collected via GLOBE Observer in the next part of the teaching box.
Credit: NASA
Discuss cloud findings
Have students share what cloud types they identified and what percentage of the sky they found covered with clouds. Remind students that clouds often will not look like one cloud type precisely. They can have attributes of different types.
Describe the focus of this module
- Tell students that in the next activity, they will learn more about the conditions that cause certain cloud types to form in a storm.
- Ask students how they think clouds might affect the temperature of the ground surface and the lower atmosphere. (Students may note several ideas, which are all welcome at this stage.) Tell students that they will explore how clouds affect climate and how climate affects clouds later in the module.
Explore how different cloud types form in different parts of a storm.
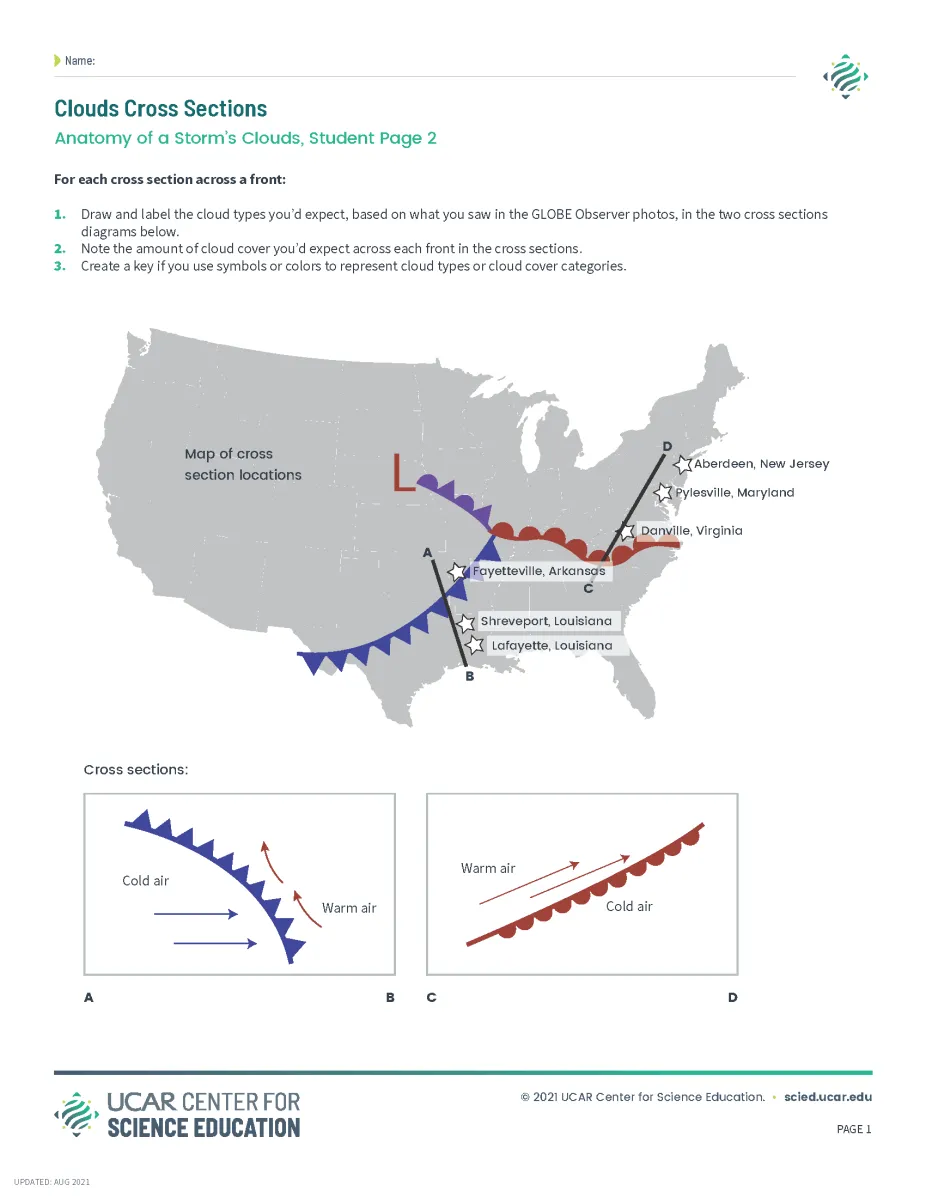
Students complete this student page after identifying clouds from photographs taken along two cross sections to discover the pattern of cloud types across warm and cold fronts.
UCAR/L.S. Gardiner
Anatomy of a Storm’s Clouds: In this activity, students identify cloud types and cloud cover from a storm that crossed the eastern half of the United States in late November 2019. In the process of analyzing photos of the clouds, students discover that different cloud types are found along a cold and warm front. Students make cross sections to document the pattern of clouds they’d expect across a warm and cold front based on what they learned from the data.
Explain why cyclones form in the mid-latitudes and how climate warming could affect the geography of these storms.
This activity will take 20-40 minutes depending on the level of the students and how dynamic the conversation becomes. Less advanced student may benefit from a more scaffolded approach with prompts to help guide their investigation of each visualization. Students should apply what they learned about fronts in the previous activity. It would be helpful for students to have some prior knowledge of climate change.
Claim-Evidence-Reasoning 1: Why do these storms form in the mid-latitudes?
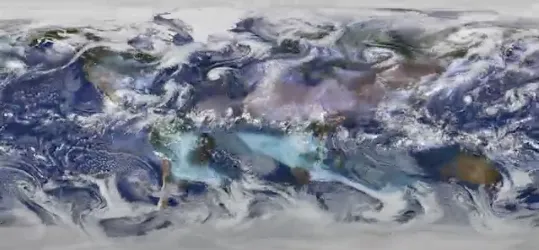
- Show the NASA Visualization of Global Clouds and indicate the mid-latitude cyclones. Have students make observations of the patterns they see at different latitudes.
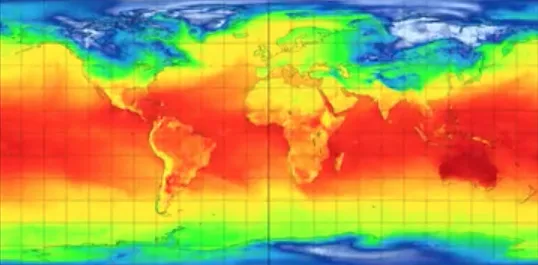
- Show the NCAR Visualization of Global Temperatures. This animation shows air temperature at 2 meters above the surface from January 1 to February 24, 2014. Ask students to make observations and note that Earth is warmer at the equator than the poles.
- Have students write a claim about why mid-latitude cyclones happen in the mid-latitudes (on paper) and have them write an explanation of their reasoning and evidence that supports their claim. (Evidence could come from prior knowledge, the previous activity, or the two visualizations. Student answers should include that a mid-latitude cyclone happens where cold and warm air come together, which is most common at mid-latitudes.)
Claim-Evidence-Reasoning 2: What might happen to these storms as the Earth warms?
- Pose the question, “What might happen to mid-latitude cyclones as the global climate warms?” (If the class needs an overview of climate change, have them read the short UCAR article Why Earth Is Warming.)
- Have students write a claim and then write an explanation of their reasoning and evidence to support the claim. (As this question is somewhat speculative, student answers may vary. Look for answers that mention the importance of having warm and cold air coming together for mid-latitude cyclone formation, and how there might be less cold air in the future or the cold air will be further north.)
- Review student claims and then describe what scientists know about possible changes in these storms as temperatures warm.
- The tropics may expand north and south of the equator, which would shift these storms poleward. (If students are familiar with global atmospheric circulation, add detail that the Hadley cell may expand in size.)
- The Arctic is expected to warm more than anywhere else on the planet. (If students are familiar with climate feedbacks, add that this is in part due to the ice-albedo feedback - replacing highly reflective ice and snow with darker land and ocean surfaces that absorb sunlight). As the Arctic warms, there may be less cold air in the north, so mid-latitude cyclones may become weaker or less frequent.
- As the climate warms, warmer air can hold more water vapor. Thus, storms could be able to produce more rainfall.
- Explain that this is an area of active research. Scientists are running computer models to understand how future weather might change as the Earth warms and what other factors could compound the effect of warming and changes in weather.
Elaborate, thinking globally about how climate warming may affect clouds.
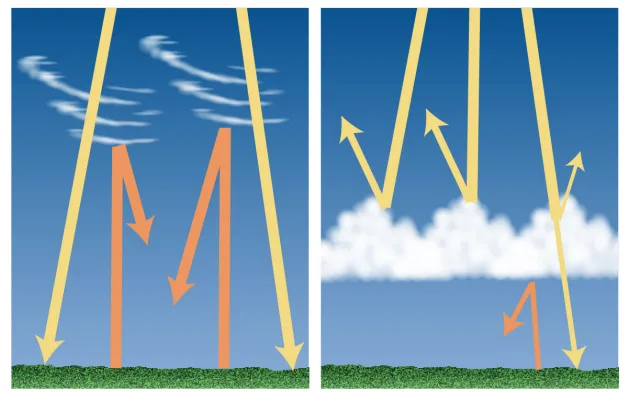
In this activity, students interpret five graphics, including this one, which shows incoming solar radiation in yellow and infrared radiation (heat) in orange. At the left are high, cirrus clouds. On the right are low, cumulus clouds. These cloud types affect climate differently.
Credit: UCAR/L.S. Gardiner
Get the Picture - Clouds and Climate: In this activity, students review science graphics that each tell a piece of the story about the effects of clouds on climate. They answer “True and False” questions about each visual and discuss what they take away from the information. They apply what they learned in the previous lessons as they consider cloud feedbacks on climate.
Evaluate student understanding of how different clouds can affect climate.
Have each student make a graphic organizer to describe three cloud types: cirrus, cumulus, and stratus and indicate:
- What the cloud type looks like and how to identify it
- Where it typically forms in a mid-latitude cyclone (along the warm front or cold front, ahead or behind the front)
- Whether the cloud type acts to warm or cool the climate and why
Students’ graphic organizers should include:
- The visual differences in the cloud types according to the identification aids used in the first two days of instruction and level in the atmosphere (low for cumulus and stratus, and high for cirrus)
- That cumulus clouds are typical along the cold front of a mid-latitude cyclone while stratus clouds are typically found along the warm front, and cirrus clouds are common ahead of the warm front
- Cirrus clouds have a warming effect because they trap more energy than they reflect, while both stratus and cumulus clouds have a cooling effect because they reflect more energy than they trap.
Extensions and resources:
- If you wish to expand this, have students choose one or more additional cloud types to profile using the three types of information provided above.
- Consider having students use free online tools such as Canva to make their graphic organizers if you wish for them to work digitally. This will allow them to integrate photos and other visual components into their graphic organizers.
- For information about using graphic organizers, see Why Use Graphic Organizers in the Classroom?
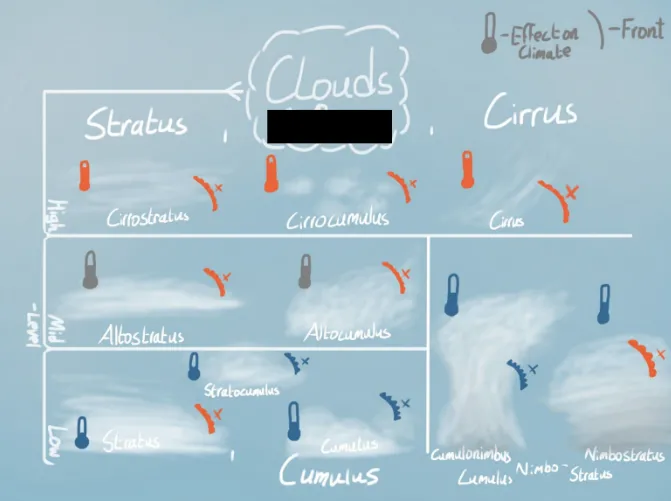
Example of a graphic organizer about clouds and climate created by a high school student who was a part of the field test of this activity
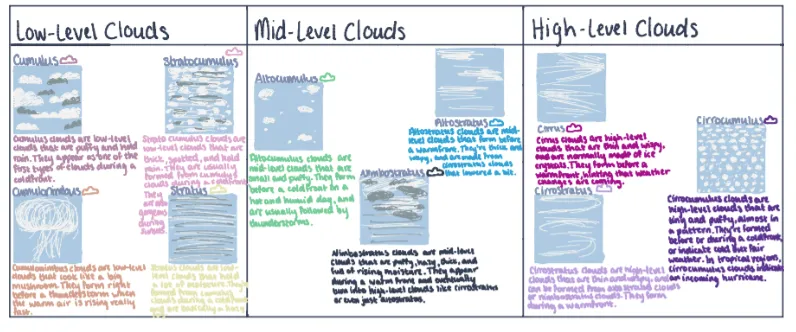
Example of a graphic organizer about clouds and climate created by a high school student who was a part of the field test of this activity