Modeling Wind Dynamics and Forests
In this activity, students will develop a model of a forest using plastic bottles and then observe and analyze changes in winds related to differences in forest density.
Learning Objectives
- Students will understand that changes in vegetation can have profound effects on wind speed.
- Students will understand that living organisms in an ecosystem affect the local atmosphere.
Materials
For a class demonstration:
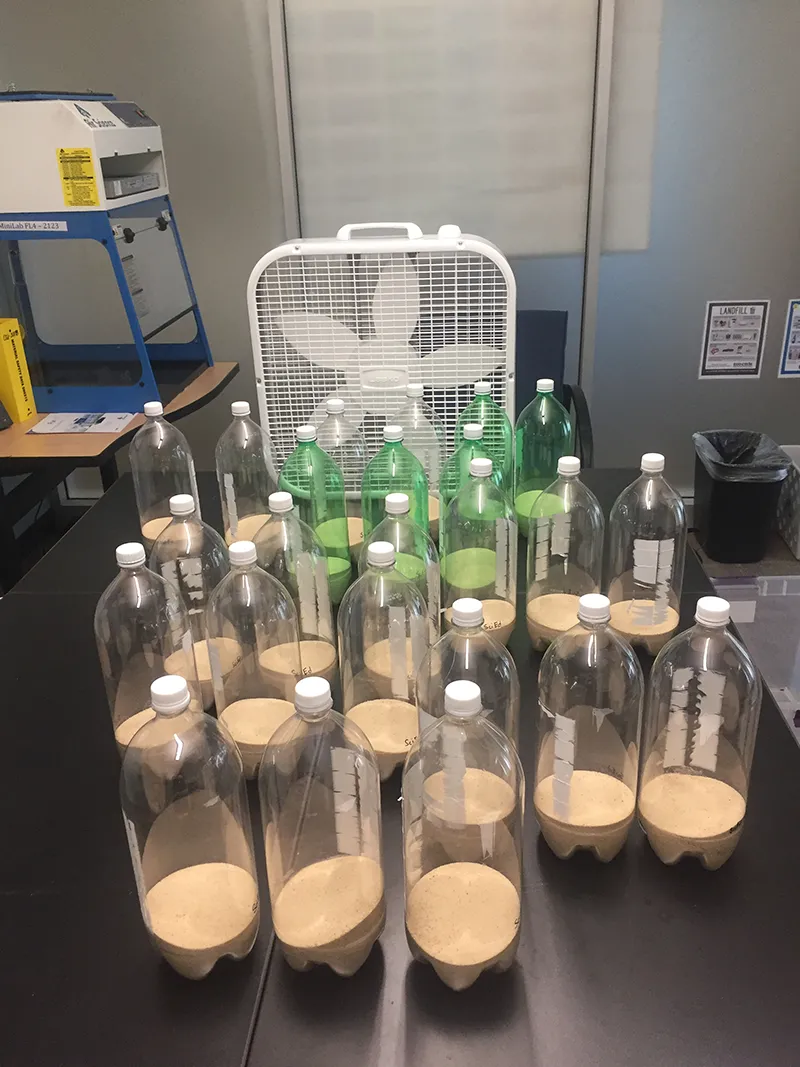
- 24 empty 2-liter plastic soda bottles
- Optional: 6 empty 1-liter plastic soda bottles
- 8-foot table (or larger)
- Sand
- Funnel
- Fan
- Wind meter (such as a digital anemometer or Kestrel)Preparation
- Fill each bottle with enough sand so that the fan on its highest setting will not cause the bottles to topple over.
For each student:
Directions
- Introduce the activity
- Help students think about what they already know how winds and trees interact. Ask the students, "On a windy day, would you feel more wind if you were in an open field or surrounded by dense trees? Why?
- Explain that, in this activity, they will develop a model forest to observe changes caused by differences in wind speed (from atmosphere) and differences in forest density (from land surface).
- Mention to students that this experiment uses materials to model a forest and wind. Bottles are used to model trees and a fan is used to model wind.
-
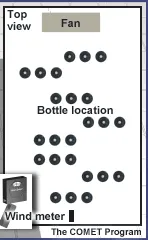
Using the prepared 24-bottles filled with sand, have the class arrange the bottles on a table in eight staggered rows (as shown below), three bottles in each row with each row approximately 12 inches apart. The bottles represent the "forest." The forest should be around 3 feet wide by 4 feet long. Make sure that the first row of bottles is close to the fan.
Note: Discuss as a class how, in most real forests, trees are not usually equally spaced.
-
At one end of the table, place a fan on a stool that is level with the table. To model this "forest" in the most realistic way, make sure that the highest winds from the fan are found above the canopy as opposed to directly at the top of canopy (the bottle caps). Adjust by increasing or decreasing the height of the fan, if needed.
-
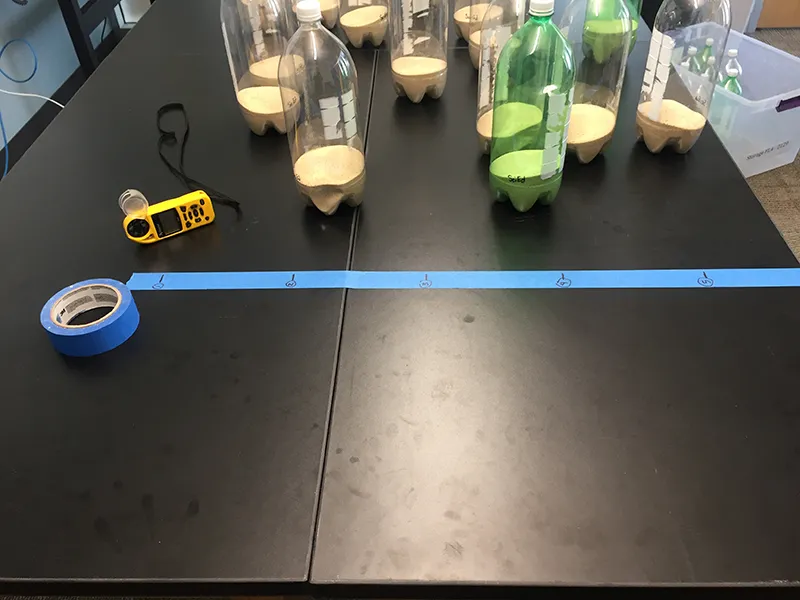
Hand out the Wind Data Tables and explain to students how they will collect wind data using the anemometer. Have students define the locations of wind measurements by placing a strip of masking tape on the table to create a transect about 8 inches from the last row of bottles (furthest from fan). The length of the tape should be equal to the width of the "forest". See image below. Have students mark where on this tape they will sample during each trial. Note those locations on the tape with a marker.
-
Place a wind meter level with the table at the opposite end from the fan.
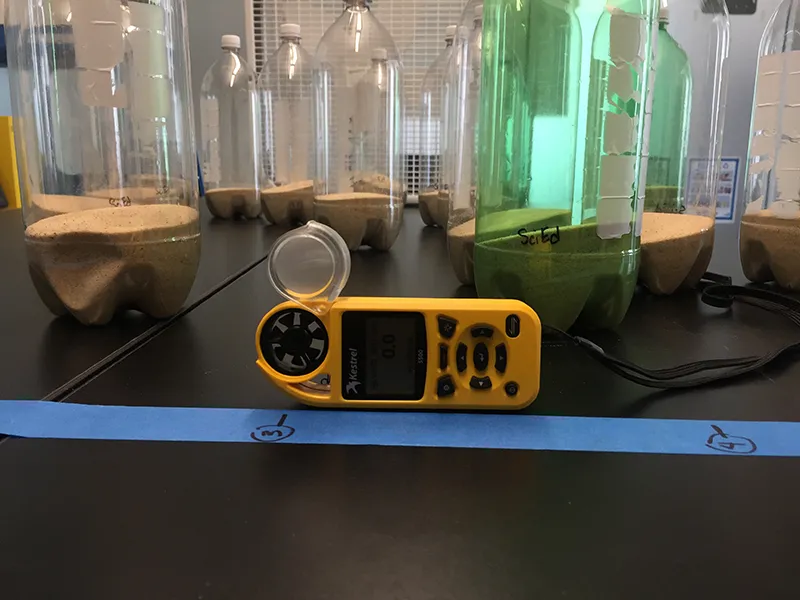
- Turn on the fan to its low setting and select a student to take wind measurements at the sampling locations. Have all students record the wind measurements on their Wind Data Tables. Students will record the wind reading at the tabletop (ground-level), at approximately six inches above the table (mid-canopy level), at the top of the bottles (top of the canopy), and slightly above the bottles (above the canopy).For each "tree" height (ex. ground-level), take a measurement at Locations 1-5 marked on the tape and record on the tables.
Note: When measuring the wind speed, one will notice that the reading depends on if the anemometer is placed directly behind or in between bottles. If directly behind, more of the wind will be blocked. This is why the students are averaging five measurements across the width of the forest to improve accuracy. - Turn the fan onto its high setting and select another student to take wind measurements along the transect. Have all students record the measurements on their Wind Data Tables.
- Remove twelve bottles, simulating a selectively cut timber operation. Repeat steps 6 and 7.
- Have students calculate and record the average wind speed using the wind speed records of Locations 1-5 for each particular "tree" height for the 24 and 12 bottle scenarios.
- Once students have calculated the wind speed averages, they can place these values into the Average Tables.
Observations and Discussion
- Have students graph the data they collected in the Wind Data Tables. Consider having students work in groups that each graph a portion of the data and then share their graphs with the class.
- Discuss what the experiment shows after students have compared their graphs.
- Have students brainstorm what could be done to improve the model.
- Discuss what else in the environment might change when a forest is cut down.
- Explain the basics of wind and how winds and trees interact. Have students articulate how vegetation can impact local wind speed, and explain how local climate is also affected by trees by changes in rainfall and evapotranspiration. Refer to the background section for more information.
Extension Activity
To make the 'forest' more realistic, you may use different sized bottles (such as adding in 1-liter bottles) to represent different ages or species, although the activity works just as well representing a 'monoculture' forest.
Assessment
- Now that the students know how trees impact wind, ask the students if they think that trees could impact the production of wind energy by wind turbines?
- Challenge students to imagine that they are tasked with placing a wind turbine in an ideal location - one that will produce the most wind energy. Would it be best to place it a forest of trees or a clear field and why?
- Now ask them to imagine if they were told that the only option was to place a wind turbine in a forest, where would the best place be?(Wind turbine needs to be taller than the trees)
- Ask students if they can think of other objects that could decrease the wind production other than a forest of trees (ex. buildings andit is recommended that the turbine be twice the height of the obstacle).
Background
Wind is air in motion.
Wind is air moving from a place that has higher pressure to one that has lower pressure. Let’s say that you blow up a balloon but don’t tie a knot at the open end. Air comes out because the pressure inside the balloon is higher than the pressure outside the balloon. Air molecules will spread out, spacing themselves far apart if they have room. The places with more air molecules have higher pressure. The areas with fewer air molecules have lower pressure. As you let the air out of the balloon, air whooshes into the area with lower pressure. That’s wind. Sometimes wind is just a light breeze and other times it is strong enough to blow the roofs off buildings. For example, thunderstorms can create high winds including microbursts and tornadoes. Another kind of wind is the prevailing wind that comes from a particular direction on a more seasonal timescale.
Winds impact trees.
Different strengths of wind have varying impacts on trees. The most obvious being downed trees and broken branches from damaging winds from extreme events such as hurricanes or tornadoes. Even though these extreme events can cause loss of lives and property, these events play an important ecological role in forests. Natural disturbances such as wind damage are actually beneficial for the forests because fallen trees open up the canopy, allowing more sunlight which leads to more diverse types and ages of vegetation. Windblown branches or fallen trees can also provide additional habitat for wildlife.Even gentle breezes and prevailing winds impact trees through transpiration, growth rate, and even the shape of the trees. Winds enhance the transpiration rate leading trees to lose water and heat that they need for growth.
Trees reduce wind speed.
It is common to use trees as windbreaks near buildings to block the wind to reduce energy costs such as heating a house in the winter. A windbreak is usually formed by planting a combination of shrubs and trees in relation to the prevailing wind direction. For example, most windbreaks in the Northern Hemisphere are planted north or northwest of a house or building because the prevailing wind comes from the west. This would be opposite in the Southern Hemisphere. Other benefits include preventing snowdrifts across driveways, noise buffer, privacy, as well as to protect livestock such as cattle on farms.
Wind also varies with altitude (height). In this activity, students learn that the lowest wind speeds occur closest to the ground when trees block most, if not all, of the wind. Higher wind speeds are found at the top of the tree (canopy-level) while the highest wind speeds occur above the tree line (above canopy-level) due to no blockage.
Deforestation impacts local climates
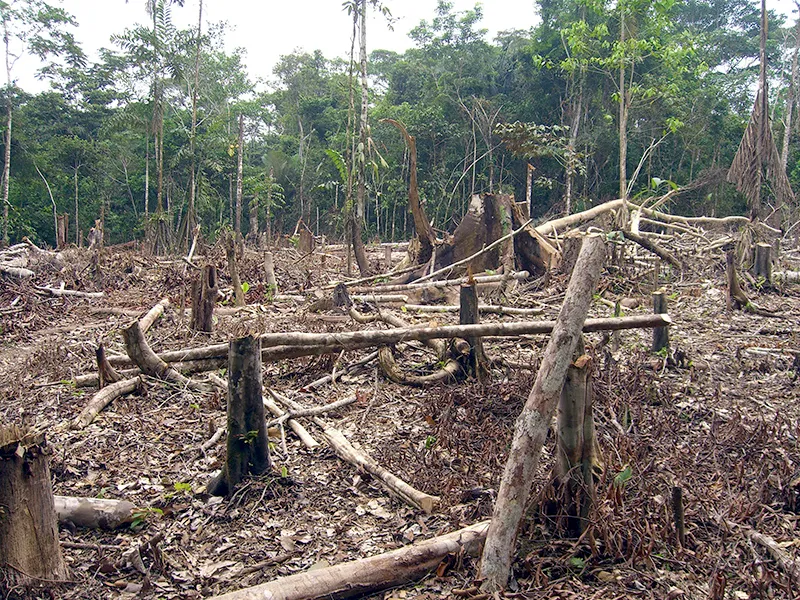
While we often think of climate as a non-biological factor that influences ecosystems, changes in the structure and distribution of living organisms in an ecosystem can, in fact, have profound climate effects both regionally and globally. Changes in vegetation affect regional atmospheric phenomena, including rainfall and evapotranspiration as well as convection and winds. It is well documented that vegetative changes due to human activity have consequences for local climate. For example, deforestation leads to higher wind speeds and therefore more soil moisture loss and wind erosion. In addition, deforestation increases the albedo (reflectivity) of the land surface, further reducing local rainfall.