Skip to main content
Main navigation
Center for Science Education
Contact Us
Search SciEd
Home
About
Collaborate with Us
Affiliations and Partnerships
Supporters
UCAR Center for Science Education Logo
Educators
Teaching Resources
School Field Trips to NSF NCAR
Join Us Virtually
Teacher Professional Development
Explore
Learning Zone
SkySci for Kids
Explore Virtually
Careers in STEM
STEM at Home
Visit
Visit NSF NCAR
Join Us Virtually
Exhibits
Visitor Accessibility
Events
Support Our Mission
Search SciEd
Contact Us
Image Gallery
15 images
Topic
- Any -
Air Quality
Clouds
How Weather Works
Storms and Other Weather
Earth as a System
How Climate Works
Impacts of Climate Change
Solving Climate Change
Layers of the Atmosphere
Sun and Space Weather
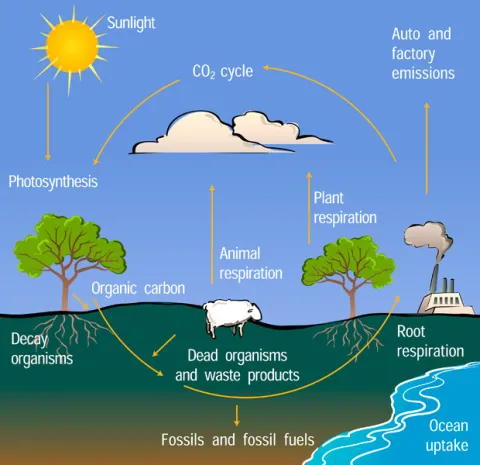
Carbon Cycle Diagram
Carbon Cycle Diagram from the DOE
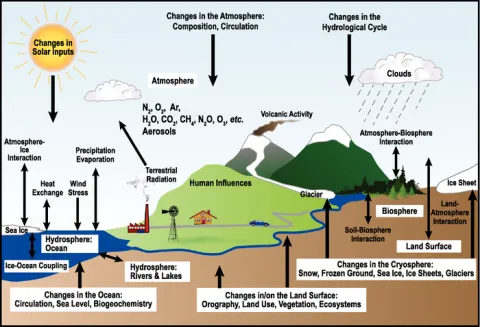
Climate system from IPCC AR4
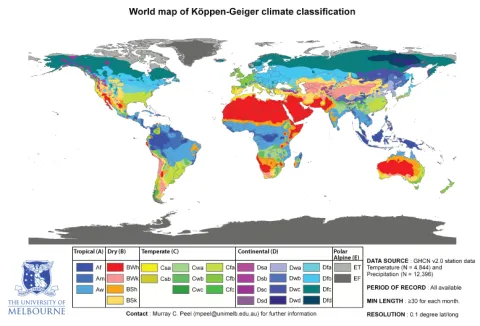
Climates of the World
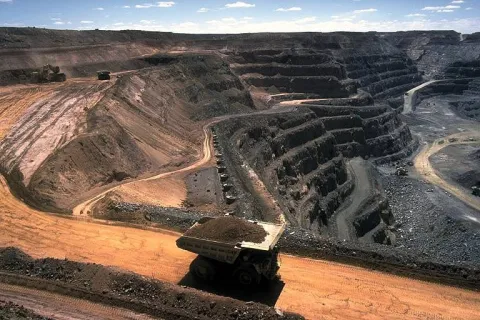
Coal Strip Mine
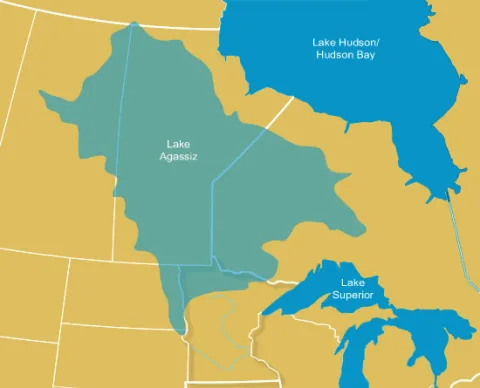
Glacial Lake Agassiz
Global annual mean surface temperature change
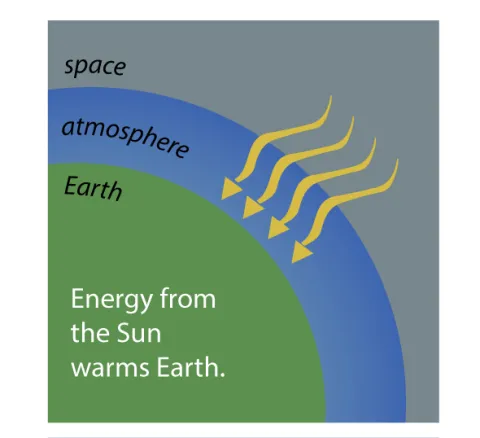
How Greenhouse Gases Trap Heat
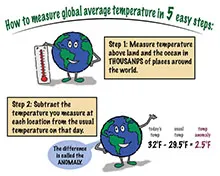
How to Measure Global Average Temperature in Five Easy Steps
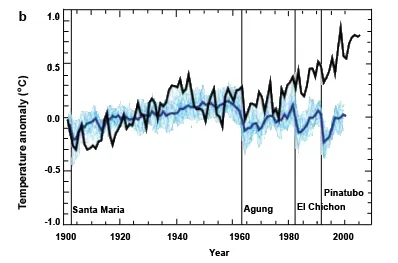
Just Add Humans: Model Simulations of 20th Century Climate
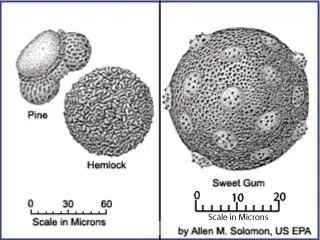
Pollen Picture
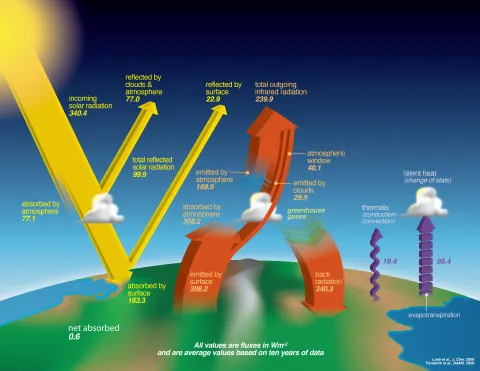
Radiation Budget Diagram for Earth's Atmosphere
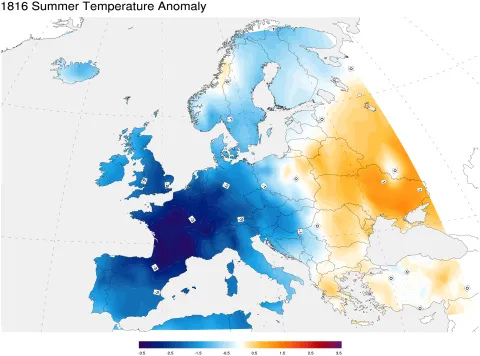
The Year Without a Summer
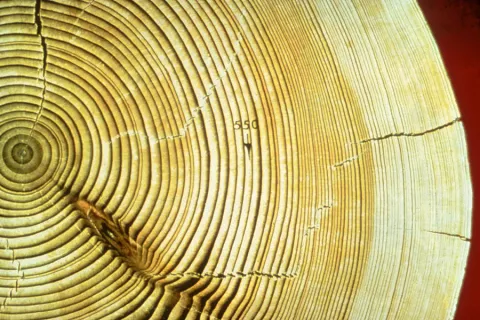
Tree Rings
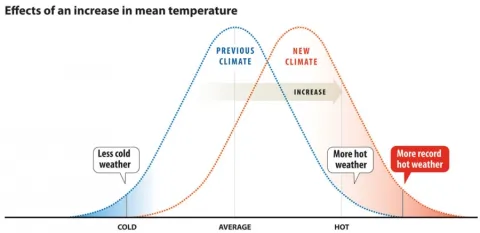
What Does it Mean to Change the Mean?