Indirect Evidence of Climate Change
Studying all of the ways that the Earth responds to warming is essential to understanding how our planet is changing, and how it may change in the future as warming continues. This means studying not only direct evidence of climate change, but also indirect evidence. Indirect evidence is important for building accurate climate models, determining the rate of climate change, and studying ancient climate conditions.
What is Indirect Evidence?
Indirect evidence of climate change is measurements of things that are affected by climate and climate change. While direct measures of climate, such as average temperature or precipitation, tell a story about changing temperature, indirect measurements tell a story about the changes that are happening because of changing temperature, such as changes in ocean currents, frequency of hurricanes, or the melting of sea ice. Both direct and indirect measurements are important for understanding the true scale of climate change.
How Do We Gather Indirect Evidence of Climate Change?
Many different types of scientists study how things in the natural world are affected by or respond to changes in climate. For example, biologists investigate changes in the distribution of plants and animals, polar researchers investigate melting ice in the Arctic, and oceanographers investigate bleaching coral reefs. Even citizen scientists contribute through plant and wildlife surveys or by noticing changes in their local environment. These scientists do not necessarily measure the increasing temperature, but instead, study how changing temperature is affecting Earth's systems.
Other scientists who study indirect evidence do so to understand historic or prehistoric changes in climate. Scientists do not have methods for making direct measurements of ancient climate conditions. Instead, they study indirect evidence of climate change known as proxy data. They interpret the evidence left behind - things such as fine layers of sediment preserved in ice sheets or lake beds and fossil animals, plants, and pollen. For timeframes within the past 1,000 years, researchers also work with records kept by people. These include harvest dates, records of tree flowering and lake freezing, and paintings or photographs of landscapes. By combining data from various sources, scientists develop a broad understanding of how climate has changed over hundreds, thousands, and even millions of years.
Indirect Evidence of Modern Climate Change
The indirect impacts of climate change all around us. Many of these, such as an increase in severe weather, loss of land along the coast as sea levels rise, and changing growing seasons have the potential to profoundly impact lives around the world.

This satellite image shows Hurricane Dorian (2019) at its peak. Dorian is the most destructive natural disaster in recorded history to hit the Bahamas.
Credit: NOAA
Frequency and severity of extreme weather events
The frequency of unusual or extreme weather events is a characteristic of climate. How often do droughts, floods, and blizzards happen? Are there more, fewer, or about the same number of severe storms occurring in a given year, decade, or century compared to the longer-term average? Another factor to consider is the severity of extreme weather events. If the number of severe hurricanes (category 4 and 5 on the Saffir-Simpson scale) in a year increases, although the total number of hurricanes remains steady, we still recognize this as a shift in the climate. We may have the same number of floods or droughts in a particular decade, but if the droughts last longer or the flooding covers a larger area, we presume that something about the climate has changed.

The Gulf Stream current brings warm water (shown in red) northwards.
Credit: NASA
Ocean currents
Earth's oceans play a huge role in transferring heat (or cold) from one part of the planet to another. Warm and cold ocean currents strongly affect global climate patterns, as do surface and deep ocean currents. Climate scientists track surface and deep ocean temperatures, current directions and speeds, and salinity levels. As the climate warms the oceans get warmer too, but this also means that ocean currents are circulating more heat around the Earth. When ocean currents pass along coastlines the extra heat influences the weather and climate on land too.

Spring bud-burst is happening earlier in some places because of climate change.
Credit: Creative Commons at Wikimedia
Phenology
The study of measurable events tied to the changing seasons is called phenology. Many trees bud in the spring and drop their leaves in the fall. We can observe when each species does so in different locations across the Earth. Insects also respond to changing seasons, emerging in the spring and mating when temperature and other aspects of the climate are favorable. We can also note the first freeze of the winter and the last frost of the spring.
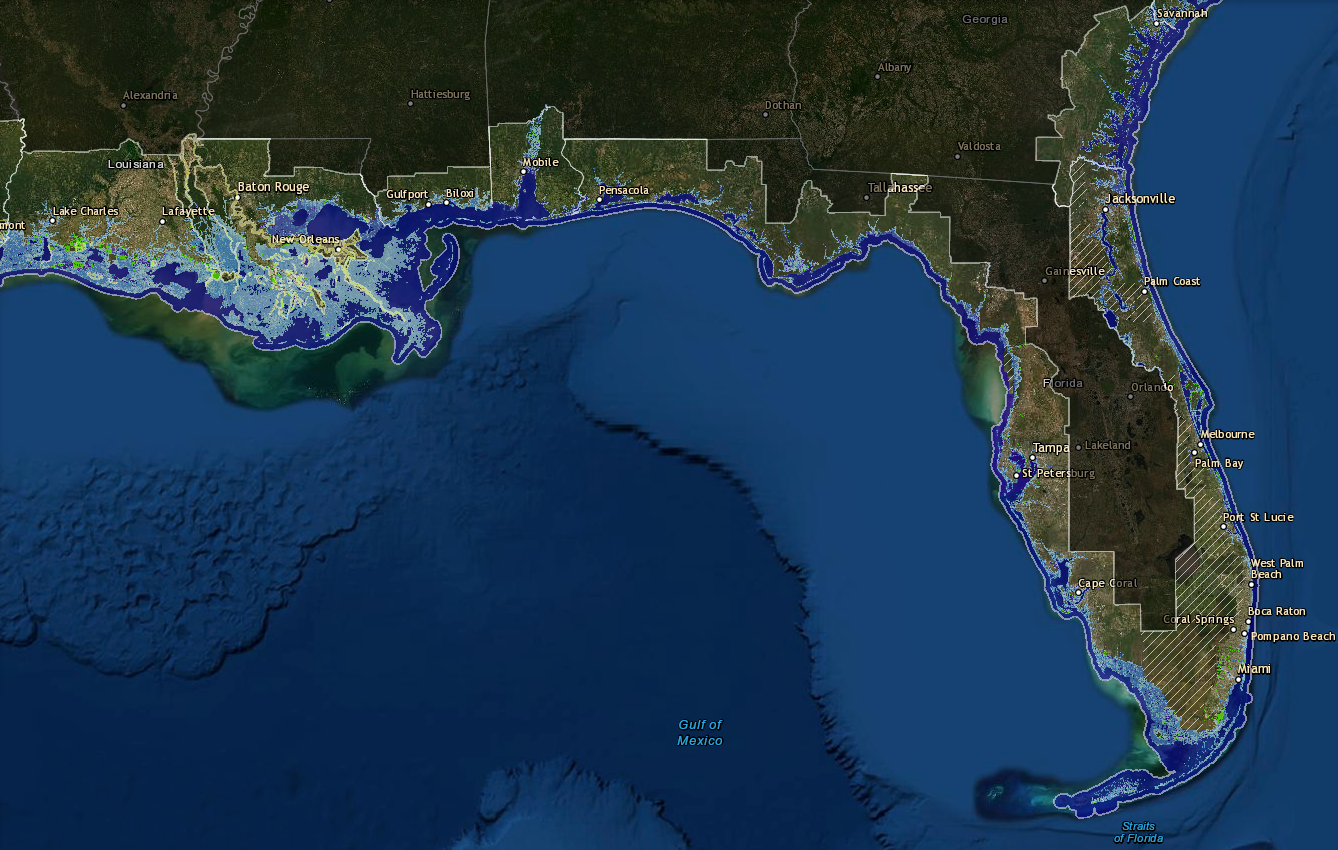
The light blue areas along the coast in this map of the Gulf of Mexico indicate the areas that would be affected by one foot of sea level rise.
Credit: NOAA (Sea Level Rise Viewer)
Sea level change
Change in sea level is a measurable quantity that is closely related to climate change. During ice ages, fresh water evaporates from the sea and freezes into ice caps over land instead of returning to the ocean as runoff, causing sea levels to drop. When the climate is warmer, the ice caps melt, the meltwater flows back to the sea, and sea levels rise. Water expands as it warms, meaning that warm water has a greater volume than colder water. This thermal expansion of water causes sea levels to rise when the climate is warming. Note that sea ice and icebergs displace the same volume as liquid water, so only ice on land (and not the ice in water) affects sea level. The movements of continents over many millions of years can also alter global sea levels without a change in the climate. When the proportion of shallow seas along continental margins to deep ocean basins changes, the overall volume of the gigantic "tub" that contains our oceans changes.

In the Arctic summer, melt ponds form over the surface of ice shelves. These pools of water reflect radiation from the sun back into the atmosphere, which amplifies the impacts of warming.
Credit: NOAA (Jeremy Mathis)
Ice and snow
Seasonal and longer-term accumulations (or losses) of ice and snow impact climate in several ways. Large ice packs, polar caps, and glaciers act as "cold reservoirs" that can prevent areas from warming in the summertime. Bright white snow and ice cover reflects sunlight, inhibiting the warming effects of the Sun's rays on a landscape or the ocean's surface. Melting ice and snow in the spring or during warming climates swells rivers with runoff and injects fresh water into salty oceans, altering currents driven by density differences between fresh and briny water. Scientists measure sea ice thickness and geographic extent, the depth of the ice sheets in Antarctica and Greenland, and the size and movement rates of glaciers. They gauge the depths of snowpacks, the albedo (brightness) of snow and ice, the calving rates of glaciers as they shed icebergs into the sea, and the melting rates of those icebergs as they drift into warmer waters.
Indirect Evidence of Past Climate Change
Earth's climate varies from place to place, but it also varies over time. Paleoclimatologists study past climates to better predict how our climate may change in the future. Climate data collected from instruments only began in the most recent centuries. Detailed thermometer based recordings of global temperature don't begin until 1850. Written accounts of climate, such as records of droughts, floods, heat waves, or cold snaps, go back a few thousand years. Earth's climate history, however, spans billions of years.

This is part of an ice core from Mt. Hunter, Alaska. The dirty ice means that this part of the sample is from the very bottom of the glacier, right above the bedrock.
Credit: NOAA (Mike Waszkiewicz)
Paleoclimate Proxies
In order to understand how climate has varied before the time of recorded history, scientists seek clues from paleoclimate proxy records. Although there are no direct ways to measure temperature or rainfall in the distant past, there are many natural phenomena that are directly influenced by the climate that can be measured. Temperature and precipitation influence the rate of growth of trees, and thus the thickness of the annual growth rings seen in tree trunks is a proxy indicator of climate. Snow falls in the polar regions, laying down layers of various thicknesses that can be viewed in ice core samples, also trapping tiny bubbles of atmospheric gases up to hundreds of thousands of years old within the ice. Rivers swollen with meltwater from spring runoffs carry sediments downstream, depositing them in layers that tell us about the flow rates and thus the depths of snowpacks. These and numerous other natural phenomena provide us with clues about past climates.
Since the data can only indirectly tell us about the climates of the past, we call these indicators proxy records. Care must be taken to tease the climate data out of the proxy records, being cautious in our interpretations as we note the uncertainties involved. Nevertheless, such proxy records can tell us a great deal about the incredibly lengthy climate history of our planet.
© 2021 UCAR with portions adapted from Windows to the Universe (© 2009 NESTA)