A Super El Niño Is Very Strong, but Even Weaker El Niños Affect the Weather
El Niño is a phase of ENSO (El Niño-Southern Oscillation), a type of climate variability. El Niño happens every few years, but it doesn’t always have the same strength and it does not cause the same impacts around the world. Scientists categorize El Niños as weak, moderate, strong, or very strong. A very strong El Niño is called a super El Niño by the news and other media.
A very strong El Niño changes weather worldwide. And the changes can last for a year or more. Torrential rains cause floods and mudslides in some places, severe droughts in other places, and unusually warm water disrupts marine life, including coral reefs. In contrast, a weak El Niño causes changes to weather that are usually confined to places like Peru that are near where El Niño originates in the eastern Pacific Ocean.
While Peruvians see early signs of El Niño in the environment because they are close to where El Niño starts, people far from the eastern Pacific can’t see the early signs for themselves. For the past few decades, tools for monitoring and forecasting El Niño have been used to predict when El Niño is on its way and whether it will be strong enough to disrupt weather globally through teleconnections.
Looking Out for Strong El Niños With Buoys, Satellites, and Models
Unusually warm water at the surface of the tropical Pacific Ocean is typically the first sign of El Niño. Water warms because winds across the Pacific weaken. Those winds move water and cause cold water to upwell from the deep, so when they are weak, less cold water gets to the ocean surface. The temperature of the warm water in the tropical Pacific indicates how strong the El Niño will be, and how far the disruptions to weather are likely to spread. During a weak El Niño, the water is at least 0.5°C (0.9°F) warmer but less than 1.0°C (1.8°F) warmer than usual. During a very strong El Niño, water is at least 2°C (3.6°F) warmer than usual.
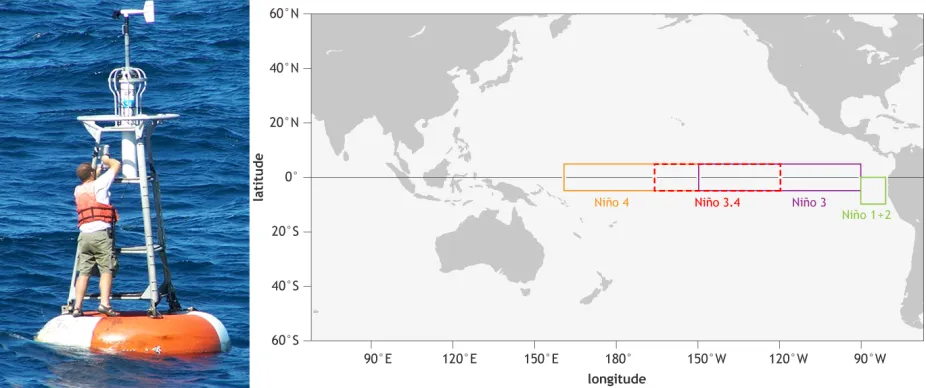
Buoys, like the one on the left, monitor the ocean and atmosphere in the tropical Pacific for signs of El Niño and other ENSO phases. There are 70 similar buoys in the regions shown in boxes on the map at the right. The temperature of the sea surface in the Niño 3.4 region (red box) indicates the strength of an El Niño or La Niña.
Source: NOAA/Lieutenant Commander Matthew Wingate NOAA Corps (left) and NOAA/Fiona Martin (right)
In the tropical Pacific, 70 buoys bob in the water as they monitor for signs of El Niño, La Niña, or the neutral phase of ENSO. Each buoy is anchored to the ocean floor with a long cable, and is outfitted with instruments to measure surface winds, the temperature at the ocean surface and at deeper depths, and other characteristics of the ocean and atmosphere. The Pacific is also monitored from ships and with satellite instruments. For example, the combination of buoy and satellite sea surface temperature data can show the tongue of warm water that spreads across the Pacific as El Niño builds.
Data from satellites and buoys are fed into a computer model that uses math equations to describe how the ocean and atmosphere work. Then, the model is run to forecast whether El Niño is likely in the coming months and how strong it may become, or if a different phase of ENSO is on its way.
In the United States, ENSO forecasts are used to make seasonal outlooks, which indicate areas that are likely to have more or less precipitation than usual and areas that are likely to be warmer or cooler than usual. For example, past El Niño events have typically caused changes to winter weather, with more precipitation than usual in southern states and less precipitation than usual in northern states. However, each El Niño is somewhat different, so computer models help forecast how a particular El Niño event will affect the weather.
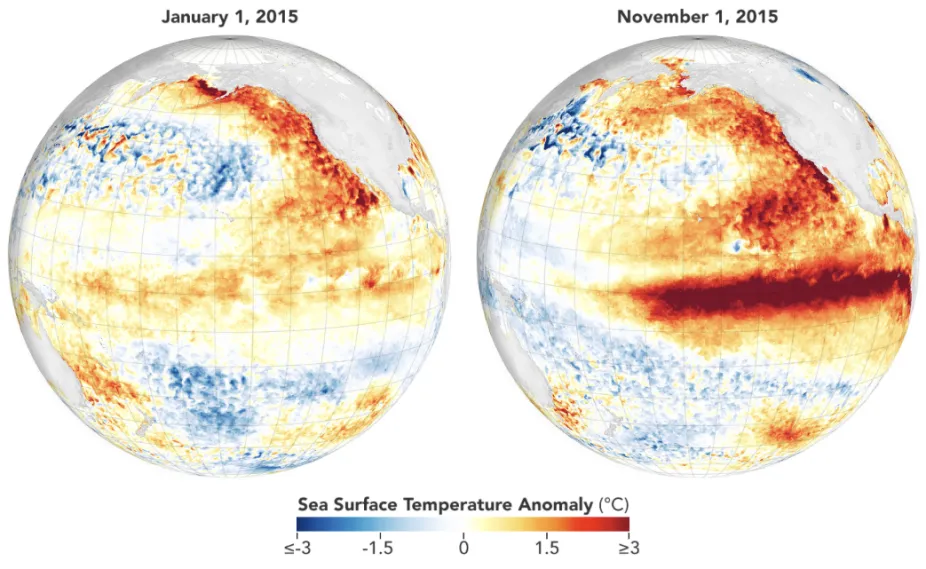
Sea surface temperatures measured by satellite instruments show that the tropical Pacific was a little warmer than normal in January 2015, as El Niño was getting started (left), and then warmed up enough to become a super El Niño by November 2015 (right).
Source: NASA Earth Observatory / Michala Garrison
El Niño Forecasts Give People Time to Prepare
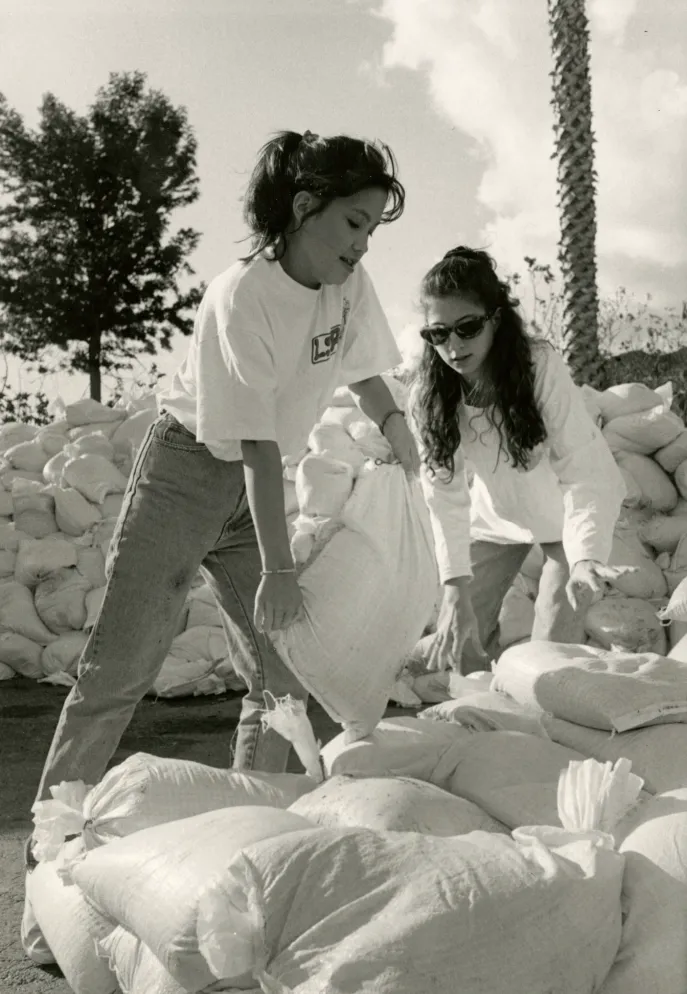
Where a strong El Niño is likely to cause heavy rain, bags filled with sand can be piled up to help prevent flooding of houses or other buildings, as these girls were doing to prepare for possible floods in Malibu, California.
Source: Pepperdine University Libraries
A very strong El Niño that lasted from mid-1982 to mid-1983 took many people by surprise. It was the strongest and most destructive El Niño event on record at the time, and it occurred before monitoring and forecasting systems had been developed. After that El Niño event, the systems of buoys, satellite data, and models were made, to help avoid surprise El Niño events in the future.
Three years after the fleet of buoys started collecting data in the Pacific, they measured unusually warm water. It was 1997 and the eastern Pacific Ocean was very warm, both at the sea surface as well as at shallower depths — a sign that a very strong El Niño was on its way. With monitoring data and models, scientists made forecasts, and then shared what to expect from the super El Niño (although that term wasn’t used at the time), which gave people time to prepare.
In California, where a very strong El Niño was predicted to cause violent rainstorms, people fixed their roofs and cleaned gutters and storm drains so that rainwater could flow away. Sandbags, which help prevent buildings from flooding, were given away for free at fire stations. To protect coastal communities from storm waves, Californians built a huge berm of sand and rocks on a beach.
The El Niño that started in early 1997 lasted until mid-1998 and turned out to be even stronger than the 1982-83 El Niño. In the years since, monitoring and forecasts have alerted people in 2015, 2023, and 2026 that strong or very strong El Niño events were likely on the way.
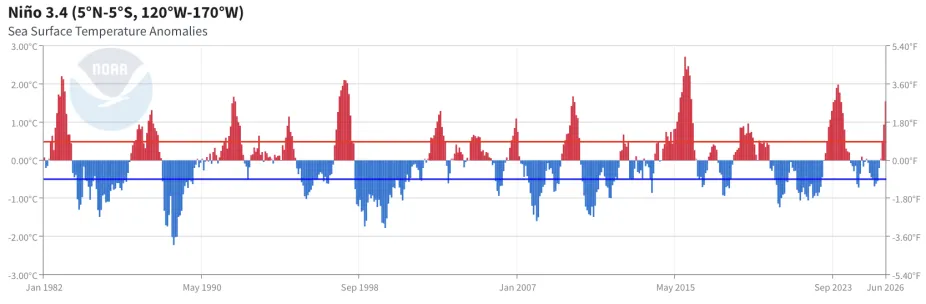
Tropical Pacific sea surface temperatures that are at least 0.5°C (0.9°F) warmer than normal (the red line) indicate El Niño, and temperatures that are at least 0.5°C cooler than normal (the blue line) indicate La Niña. The highest temperatures in the graph indicate very strong, or super, El Niño conditions.
Source: NOAA
Is El Niño Changing?
El Niño is natural, but it may be changing as the atmosphere and oceans warm. There’s a lot we do not yet know about the impacts of warming and other global shifts on El Niño, so this is an area of active research.
At NSF NCAR, scientists are using models to learn how warming affects El Niño. One team of scientists is studying whether the teleconnections of a recent strong El Niño were influenced by our warming climate. Another team of scientists used modeling to explore how the risks of heat waves and wildfires during El Niño and La Niña change as temperatures have been rising and could continue to rise long-term.
Forecasting El Niño may become more difficult as our world warms because a main clue that El Niño is starting is warmer than usual water in the tropical Pacific. But what qualifies as warmer than usual is changing as the oceans have been heating up due to the long-term changes in climate. To help keep forecasts accurate, scientists are looking for other ways to identify when an El Niño is starting. They are also adjusting how warm water is used to indicate El Niño by subtracting the amount that climate has warmed the ocean from tropical Pacific temperature measurements. If, after the subtraction, the water is still at least 2°C (3.6°F) warmer than usual, then a very strong El Niño (a.k.a. a super El Niño!) is on the way.
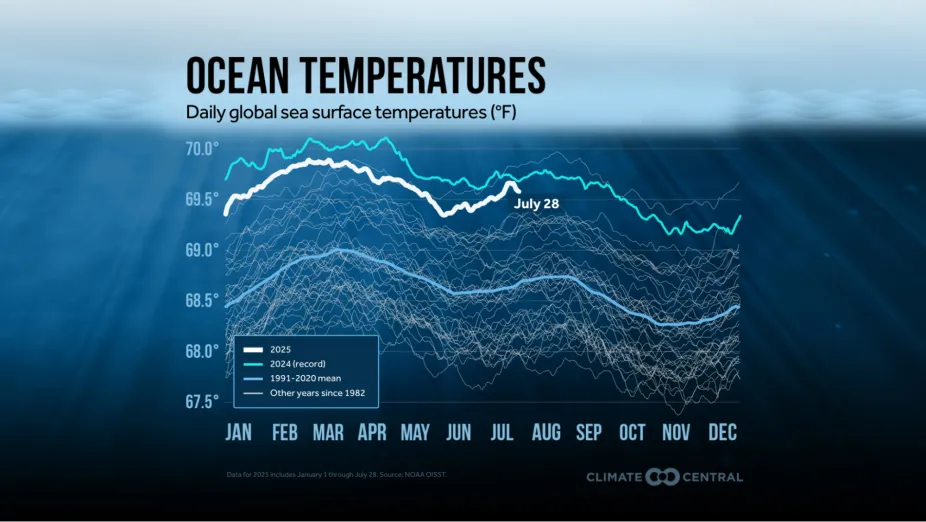
Warmer than usual sea surface temperatures (2025) in the tropical Pacific Ocean indicates El Niño, but with sea surface temperatures warming over time, scientists need to look at other indications of ENSO phases too.
Source: Climate Central