How We Study the Atmosphere
How do we know what is happening within the entire layer of air reaching about 10,000 kilometers above our heads? For centuries, people have attempted to study Earth’s atmosphere. As early as 1749, scientists experimented with tying thermometers to kites in an attempt to measure temperature at different altitudes. Today’s observing systems are much more robust and collect information not only about temperature, but also about winds and pressure at different heights in the atmosphere. Surface-based systems, instruments allowing measurements within the atmosphere (referred to as in situ observations), satellites orbiting Earth, and sophisticated weather models all work together to provide a comprehensive view of the layer of air that surrounds us.
Observations from Earth’s Surface
Instruments located at sites on Earth’s surface provide data about the atmospheric conditions at specific places. Typically, surface-based weather observing systems measure temperature; dewpoint (corresponding to humidity); precipitation accumulation, type, and intensity; air pressure; and wind speed, direction, and gusts. Some stations also provide information about cloudiness and visibility. Across many parts of the globe, these systems provide specialized information for aviation, roads and transportation, and for navigation in marine areas and along coastlines.
Some surface-based weather observing systems are small and portable, offering an opportunity to capture measurements from your school location or your own backyard and share the information through websites such as GLOBE or the Weather Underground network. Other observing systems have multiple instruments that are more specialized. For example, the U.S National Weather Service, Federal Aviation Administration (FAA), and Department of Defense collaboratively operate a network of 900 automated surface observing systems (ASOS) to monitor rapidly changing weather conditions. These observing systems are deployed across the U.S. and provide continuous, official measurements 24 hours a day.
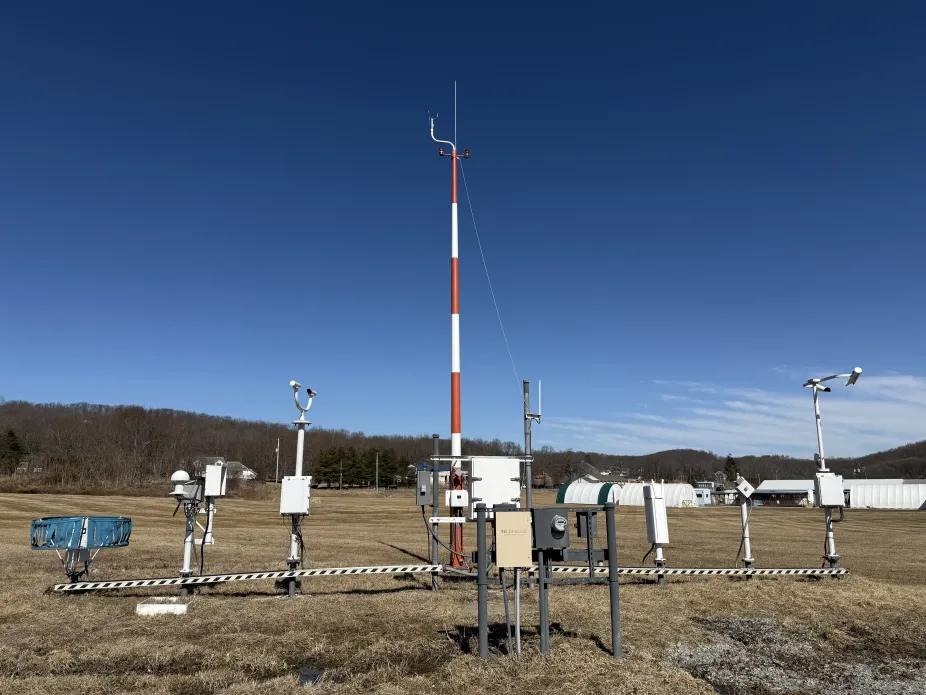
Automated surface observing systems offer a suite of instruments able to capture crucial weather information 24 hours a day, seven days a week, at hundreds of sites around the U.S.
CC BY-SA 4.0 Famartin
Observations at Different Altitudes in the Atmosphere
Observations from different heights within the atmosphere are captured using weather balloons (also known as radiosondes), aircraft, and dropsondes. The dropsonde is an instrument package tethered to a small parachute. These instruments are dropped from an aircraft above large storms and fall through the storm’s center where planes can’t safely fly. Some of the earliest dropsondes were developed by the NSF National Center for Atmospheric Research (NSF NCAR) in the late 1960s and early 1970s out of the need to have very light-weight, inexpensive instrumentation. NSF NCAR senior scientist Dr. Holger Vömel refers to the dropsonde as “an amazing success story” based on its use for monitoring hurricanes and atmospheric conditions capable of producing heavy rains. The data collected can offer insights into how strong a storm might grow and can help improve hurricane forecasting, providing information that can save lives.
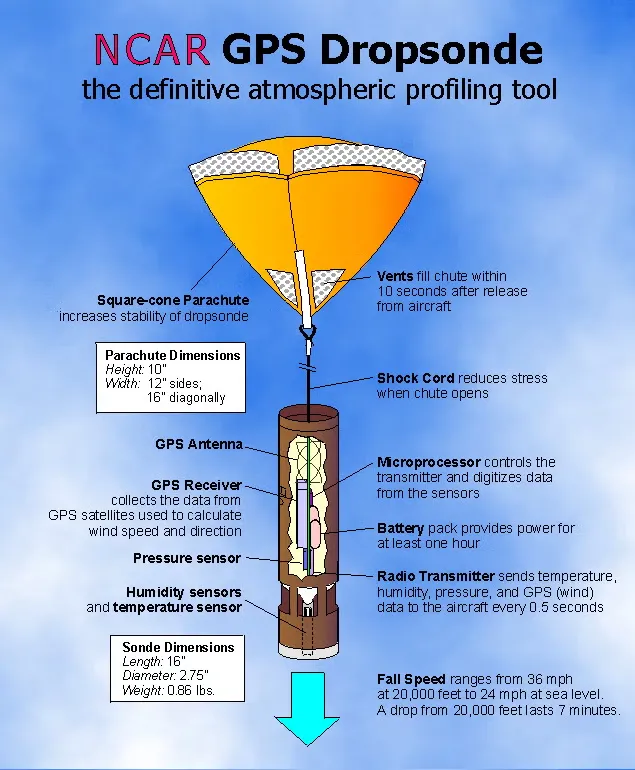
Dropsondes are attached to small parachutes and collect information on winds, temperature, and humidity as they fall through the atmosphere
NSF NCAR Earth Observing Laboratory
NSF NCAR operates aircraft with specialized instruments that can sample air in different layers of the atmosphere and measure wind, temperature, and other atmospheric information. In collaboration with Earth system scientists from universities and other organizations, these missions fly on planes that include a Gulfstream V, referred to as the High-Performance Instrumented Airborne Platform for Environmental Research (HIAPER), and the NSF NCAR C-130 aircraft.
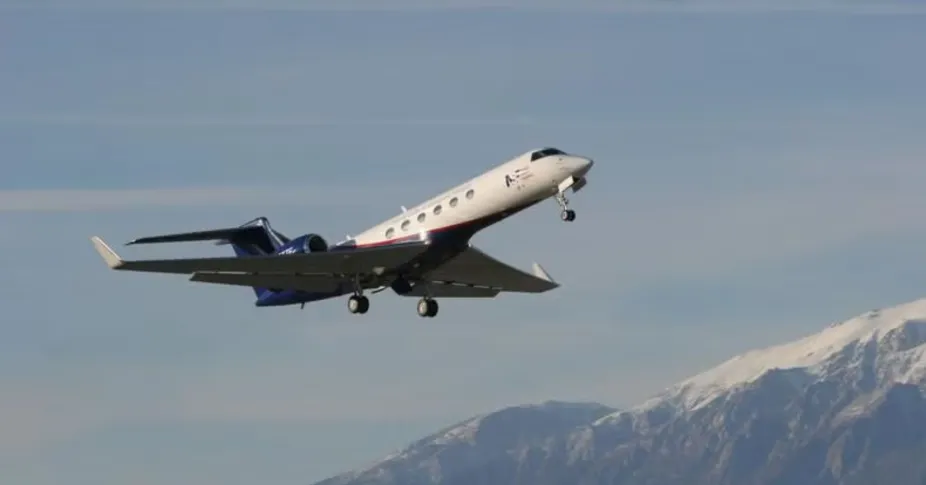
The High-Performance Instrumented Airborne Platform for Environmental Research (HIAPER) is a modified Gulfstream V with a range of 7,400 kilometers (4,000 nautical miles) and the ability to fly high in the atmosphere at 15,000 meters (49,000 feet).
NSF NCAR Earth Observing Laboratory
Instruments aboard these planes can be used to study the atmosphere around the world, including measuring what’s happening at different altitudes over remote areas of the ocean where other observations would not be available. The measurements improve our understanding of hurricanes, air quality and smoke, and many other atmospheric phenomena.
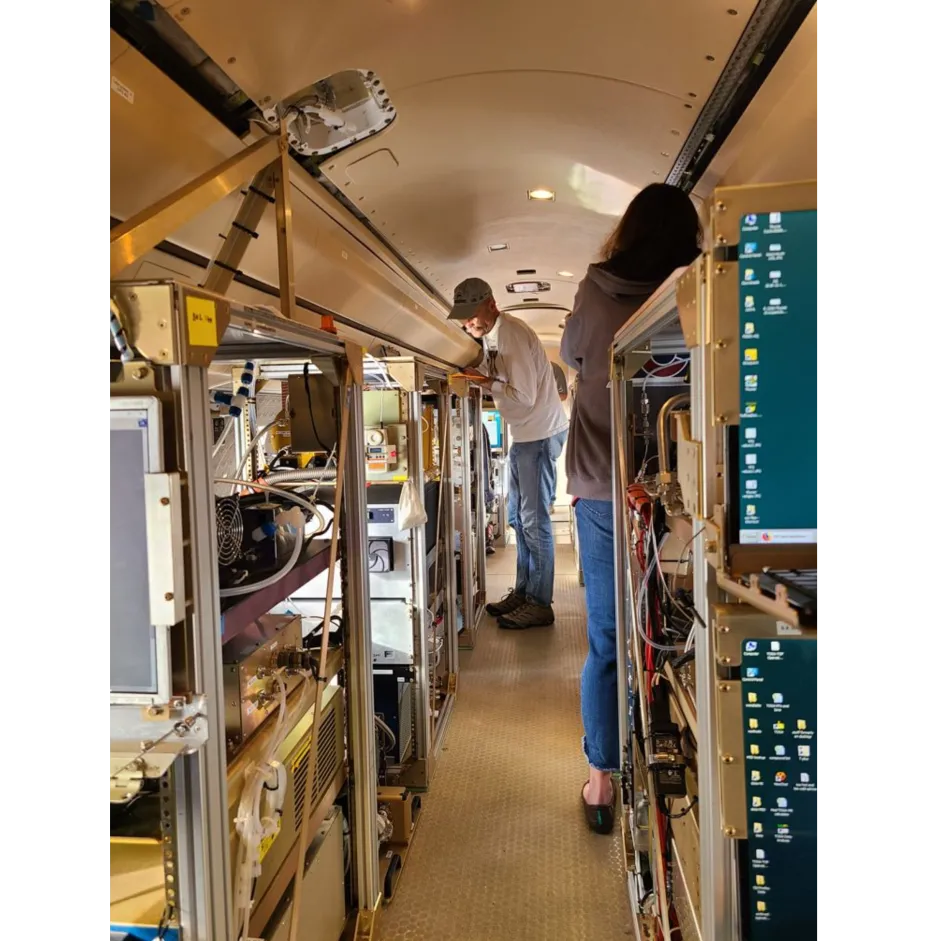
Researchers prepare instrumentation and computer systems inside the Gulfstream V as part of the 2022 Technological Innovation Into Iodine and GV Environmental Research (TI3GER) field campaign that studied processes affecting the atmosphere’s ozone layer.
Rebecca Hornbrook, University Corporation for Atmospheric Research
Observations From Space
Environmental satellites in orbit around Earth provide colorful, large-scale images and information not possible with other observing systems. In addition to the stunning visible images that can be seen from space, instruments aboard satellites provide important information about cloud types and their movement; the large-scale transport of water vapor throughout the atmosphere; smoke, aerosols, and gases in the atmosphere; and surface features on both land and ocean. Satellite instruments can see things like wildfires, snow cover, phytoplankton blooms, and even animal migration.

Observations of atmospheric features from GeoColor satellite imagery from the NOAA GOES-R satellite series. The valley fog image was captured during nighttime; the other images were taken during the daytime.
CIRA, NOAA
Models of the Atmosphere
Models of the atmosphere use the information available from observations to build a view of what might happen next. These models allow researchers to peer into the future and are able to simulate conditions like precipitation, wind, severe storm potential, and other weather information. One example, NSF NCAR’s Weather Research and Forecasting model (WRF), simulates what is happening in the atmosphere on scales of just a few kilometers to help forecast storms and other weather patterns. The real-world applications of atmospheric models are numerous and include providing airlines with guidance for in-flight turbulence and offering timely temperature and humidity information to help in deciding when to use deicing fluids on aircraft. In these and other situations, the forecasts from atmospheric models contribute directly to public safety and can help airlines and other industries save money.
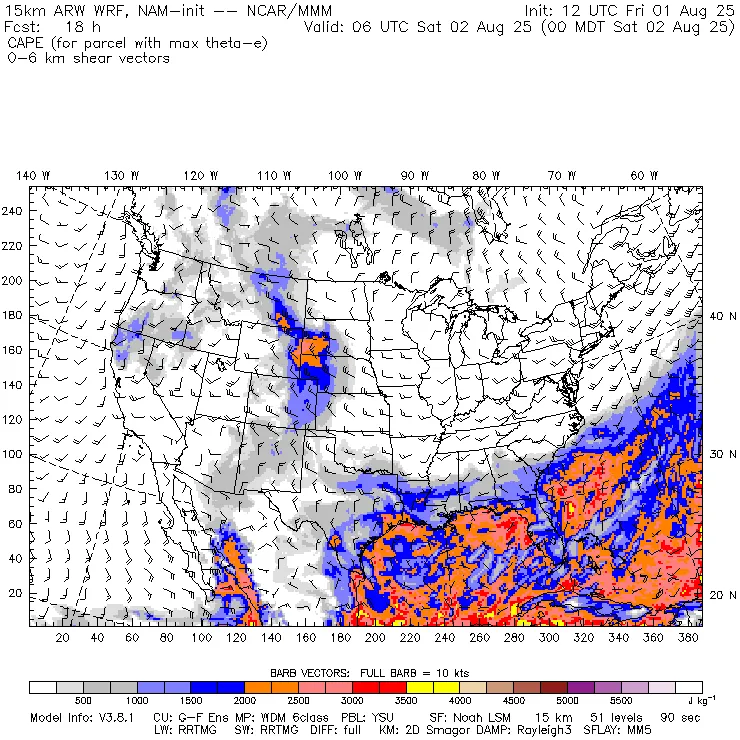
The Weather Research and Forecasting model (WRF) provides information about winds and other data to help determine the location and timing of potential severe weather.
NSF NCAR Mesoscale & Microscale Meteorology Laboratory