Beginning July 6, there will be temporary impacts to NSF NCAR Road, Parking Lot, and Trails. View more information.
186 images
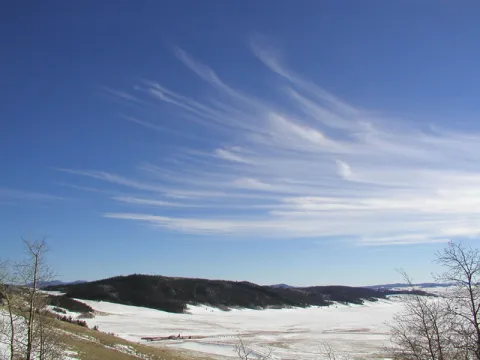
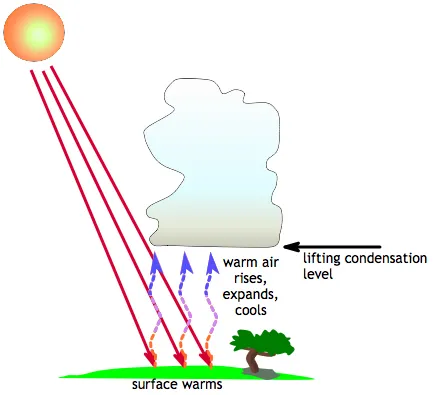
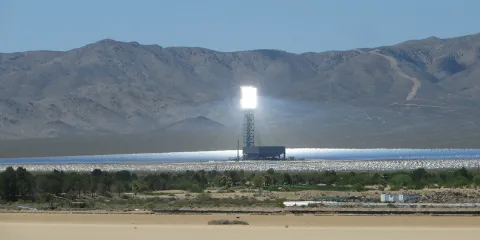
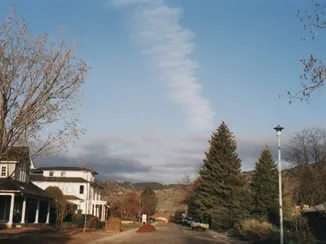
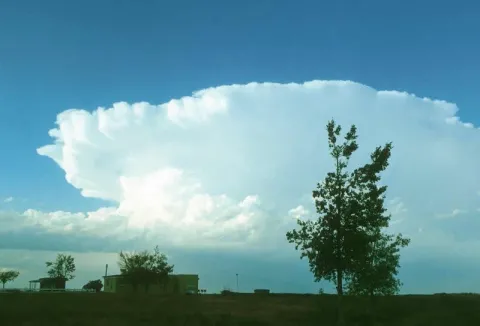
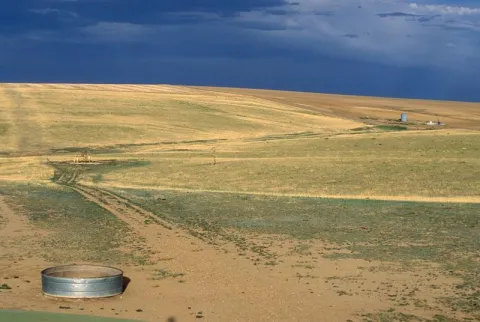
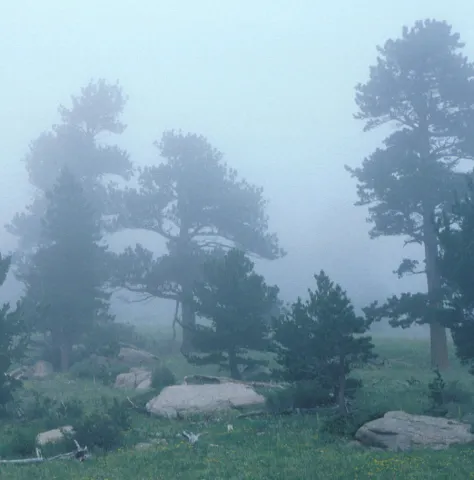
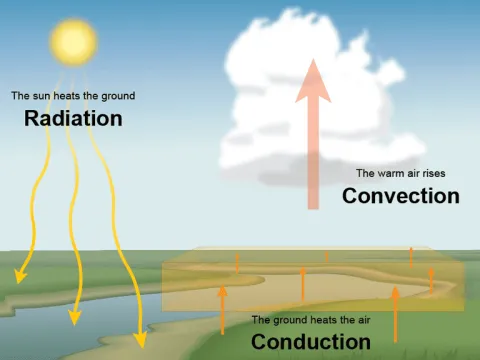
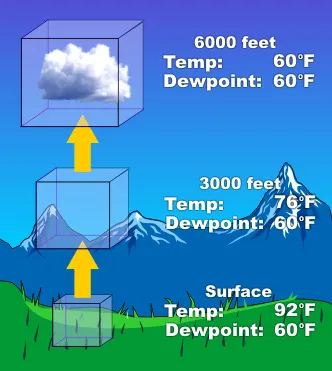
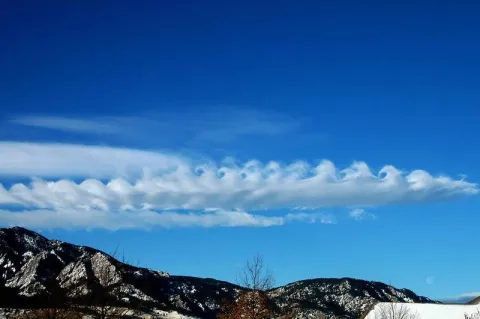
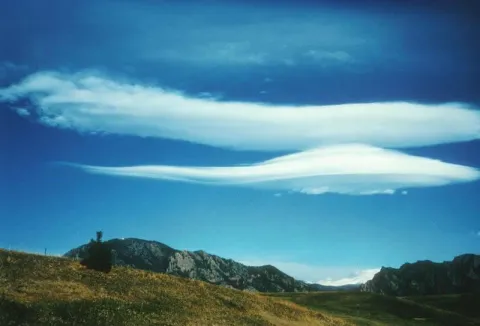
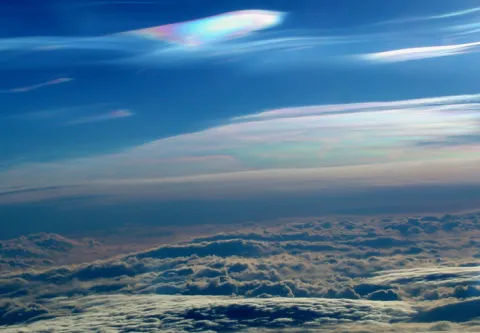
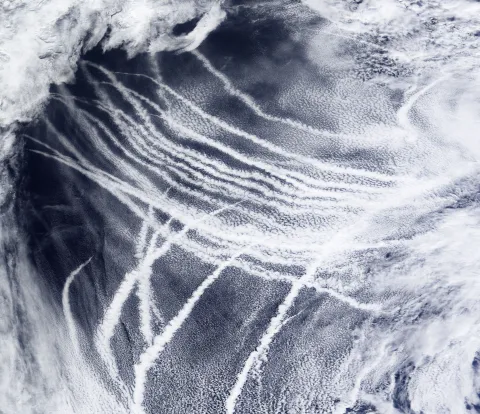
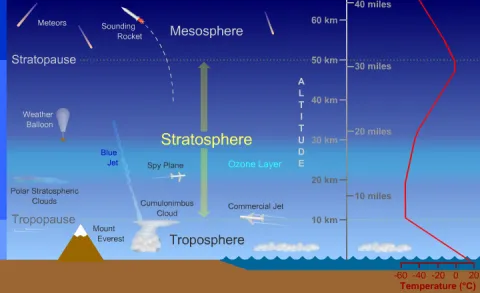
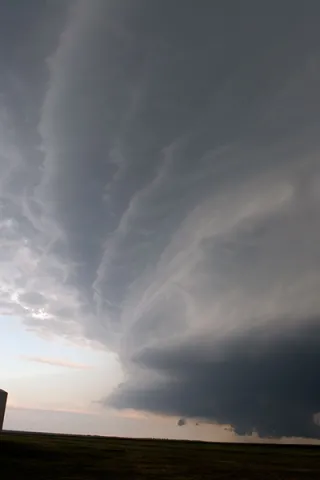
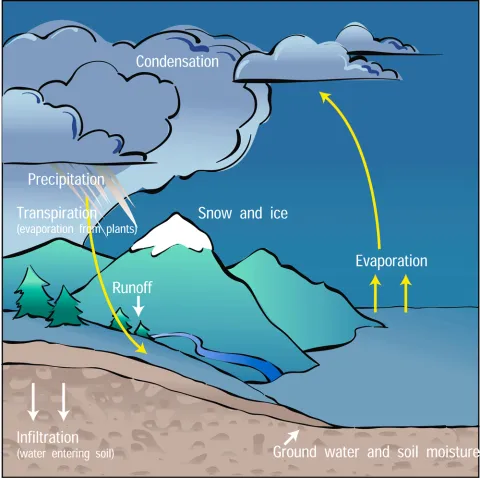
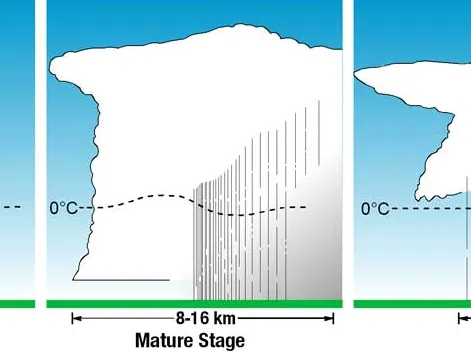
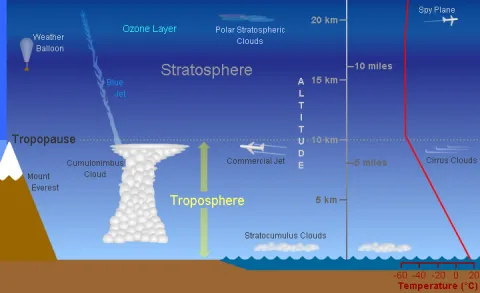
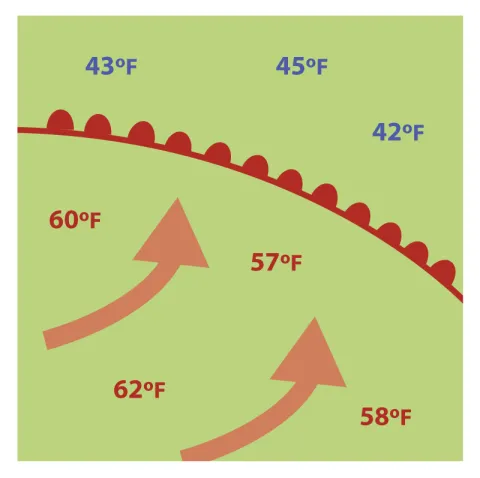
One way clouds form is when Earth's surface is warmed by sunlight, then warm air rises and cools to form clouds.
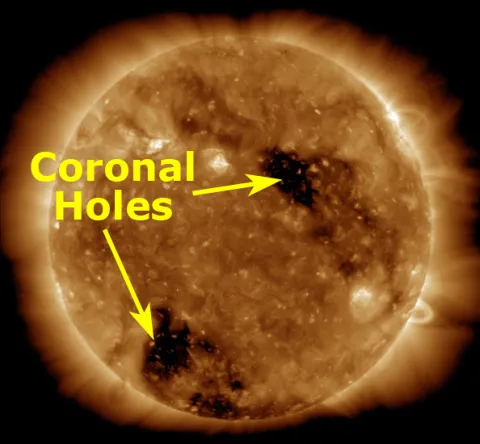
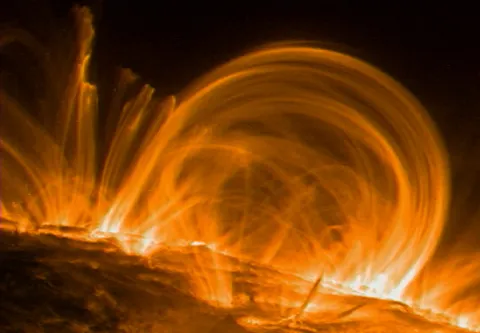
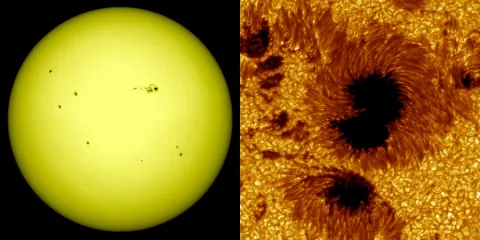
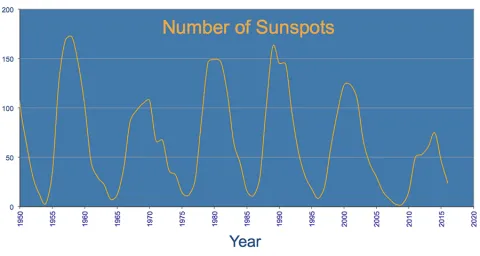
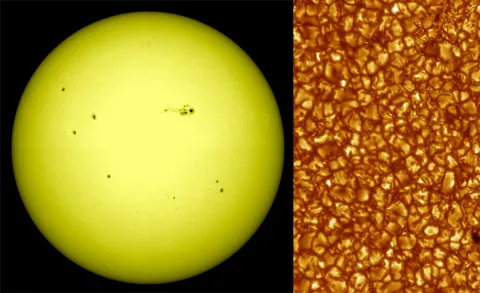
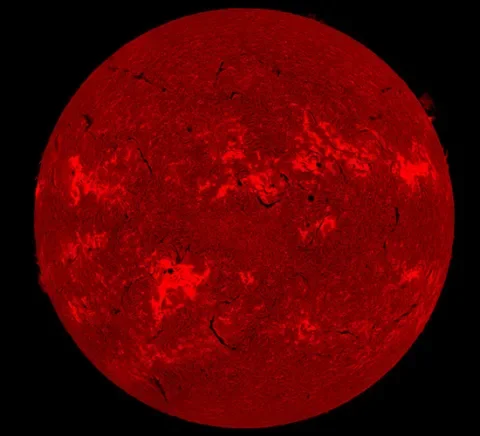
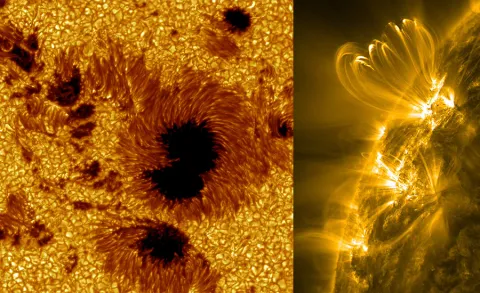
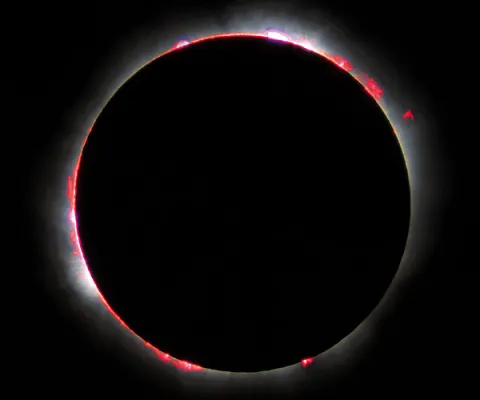
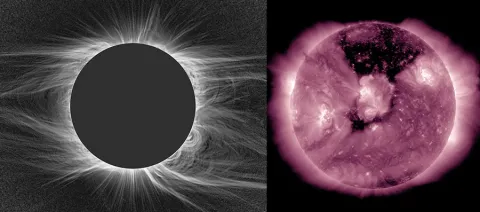
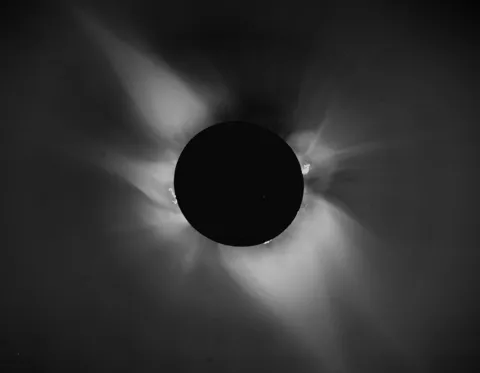
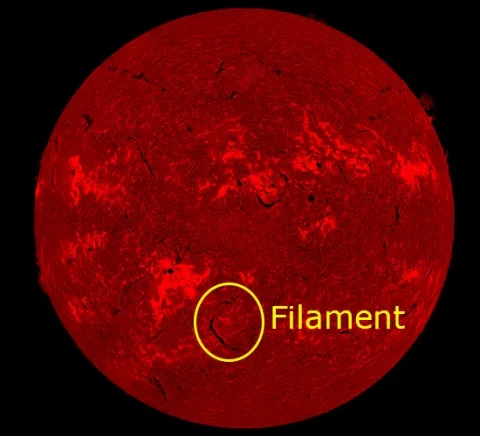
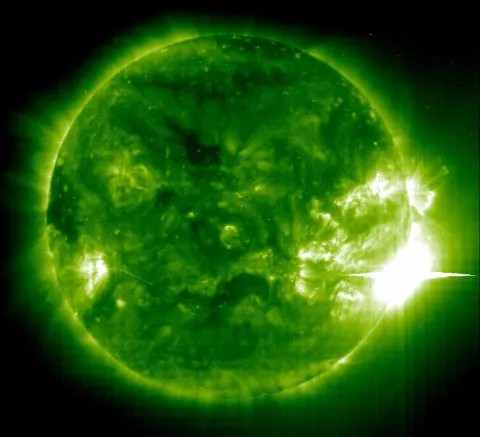
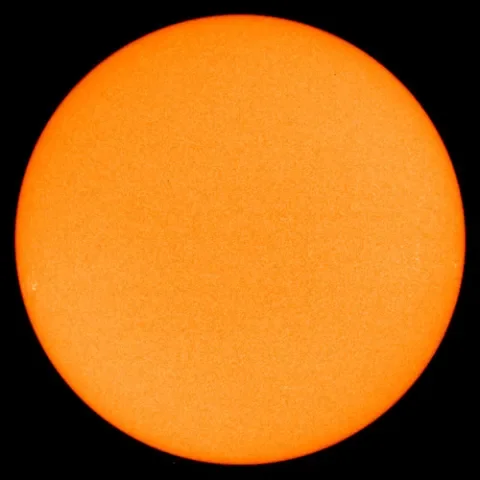
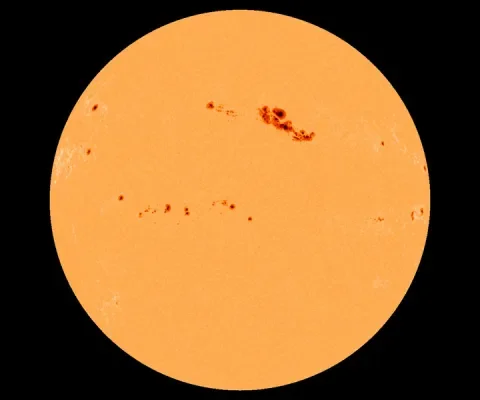
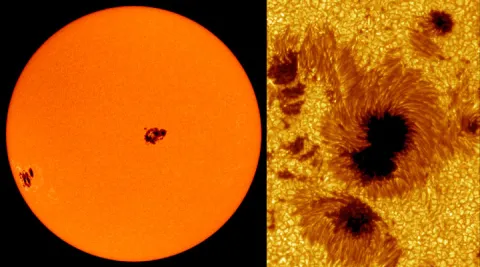
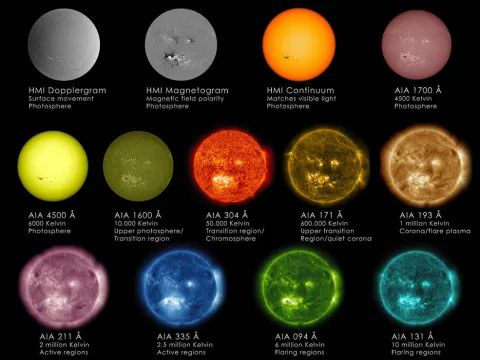
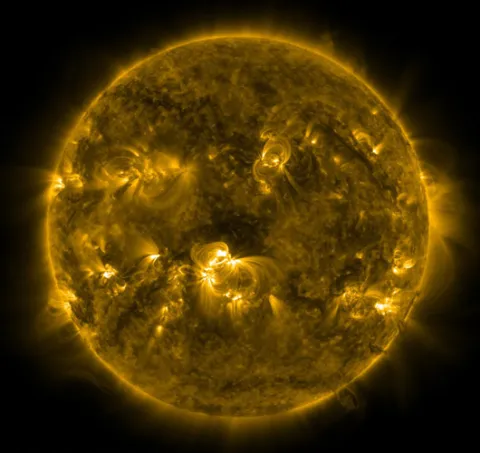
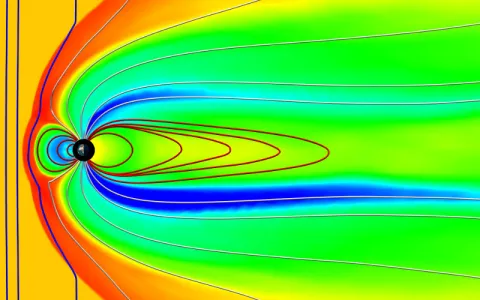
Viewing the Sun in different wavelengths helps scientists study solar features.